Overview (Session Dashboard)
The Overview view provides a central dashboard of session performance metrics, guiding statistics, and altitude calculations.
Configuration & Filters
The top toolbar lets you filter the data:
- Date: Switch between nights for multi-night captures.
- Target: Filter by deep sky object.
- Filter: Filter by light filter (e.g., H-Alpha, L).
- Pierside: View West (pre-meridian flip) or East (post-meridian flip) frames.
- Exposure: Filter by exposure length.
Tabs & Panels
1. Summary Tab
Renders a grid displaying distribution charts for key metrics: * HFR & FWHM: Stellar focus distribution. * # Stars: Detected star counts (drops indicate clouds or haze). * Eccentricity: Star roundness indicator. * Mean & Median: Image background ADU levels. * RMS: Overall guiding tracking error.
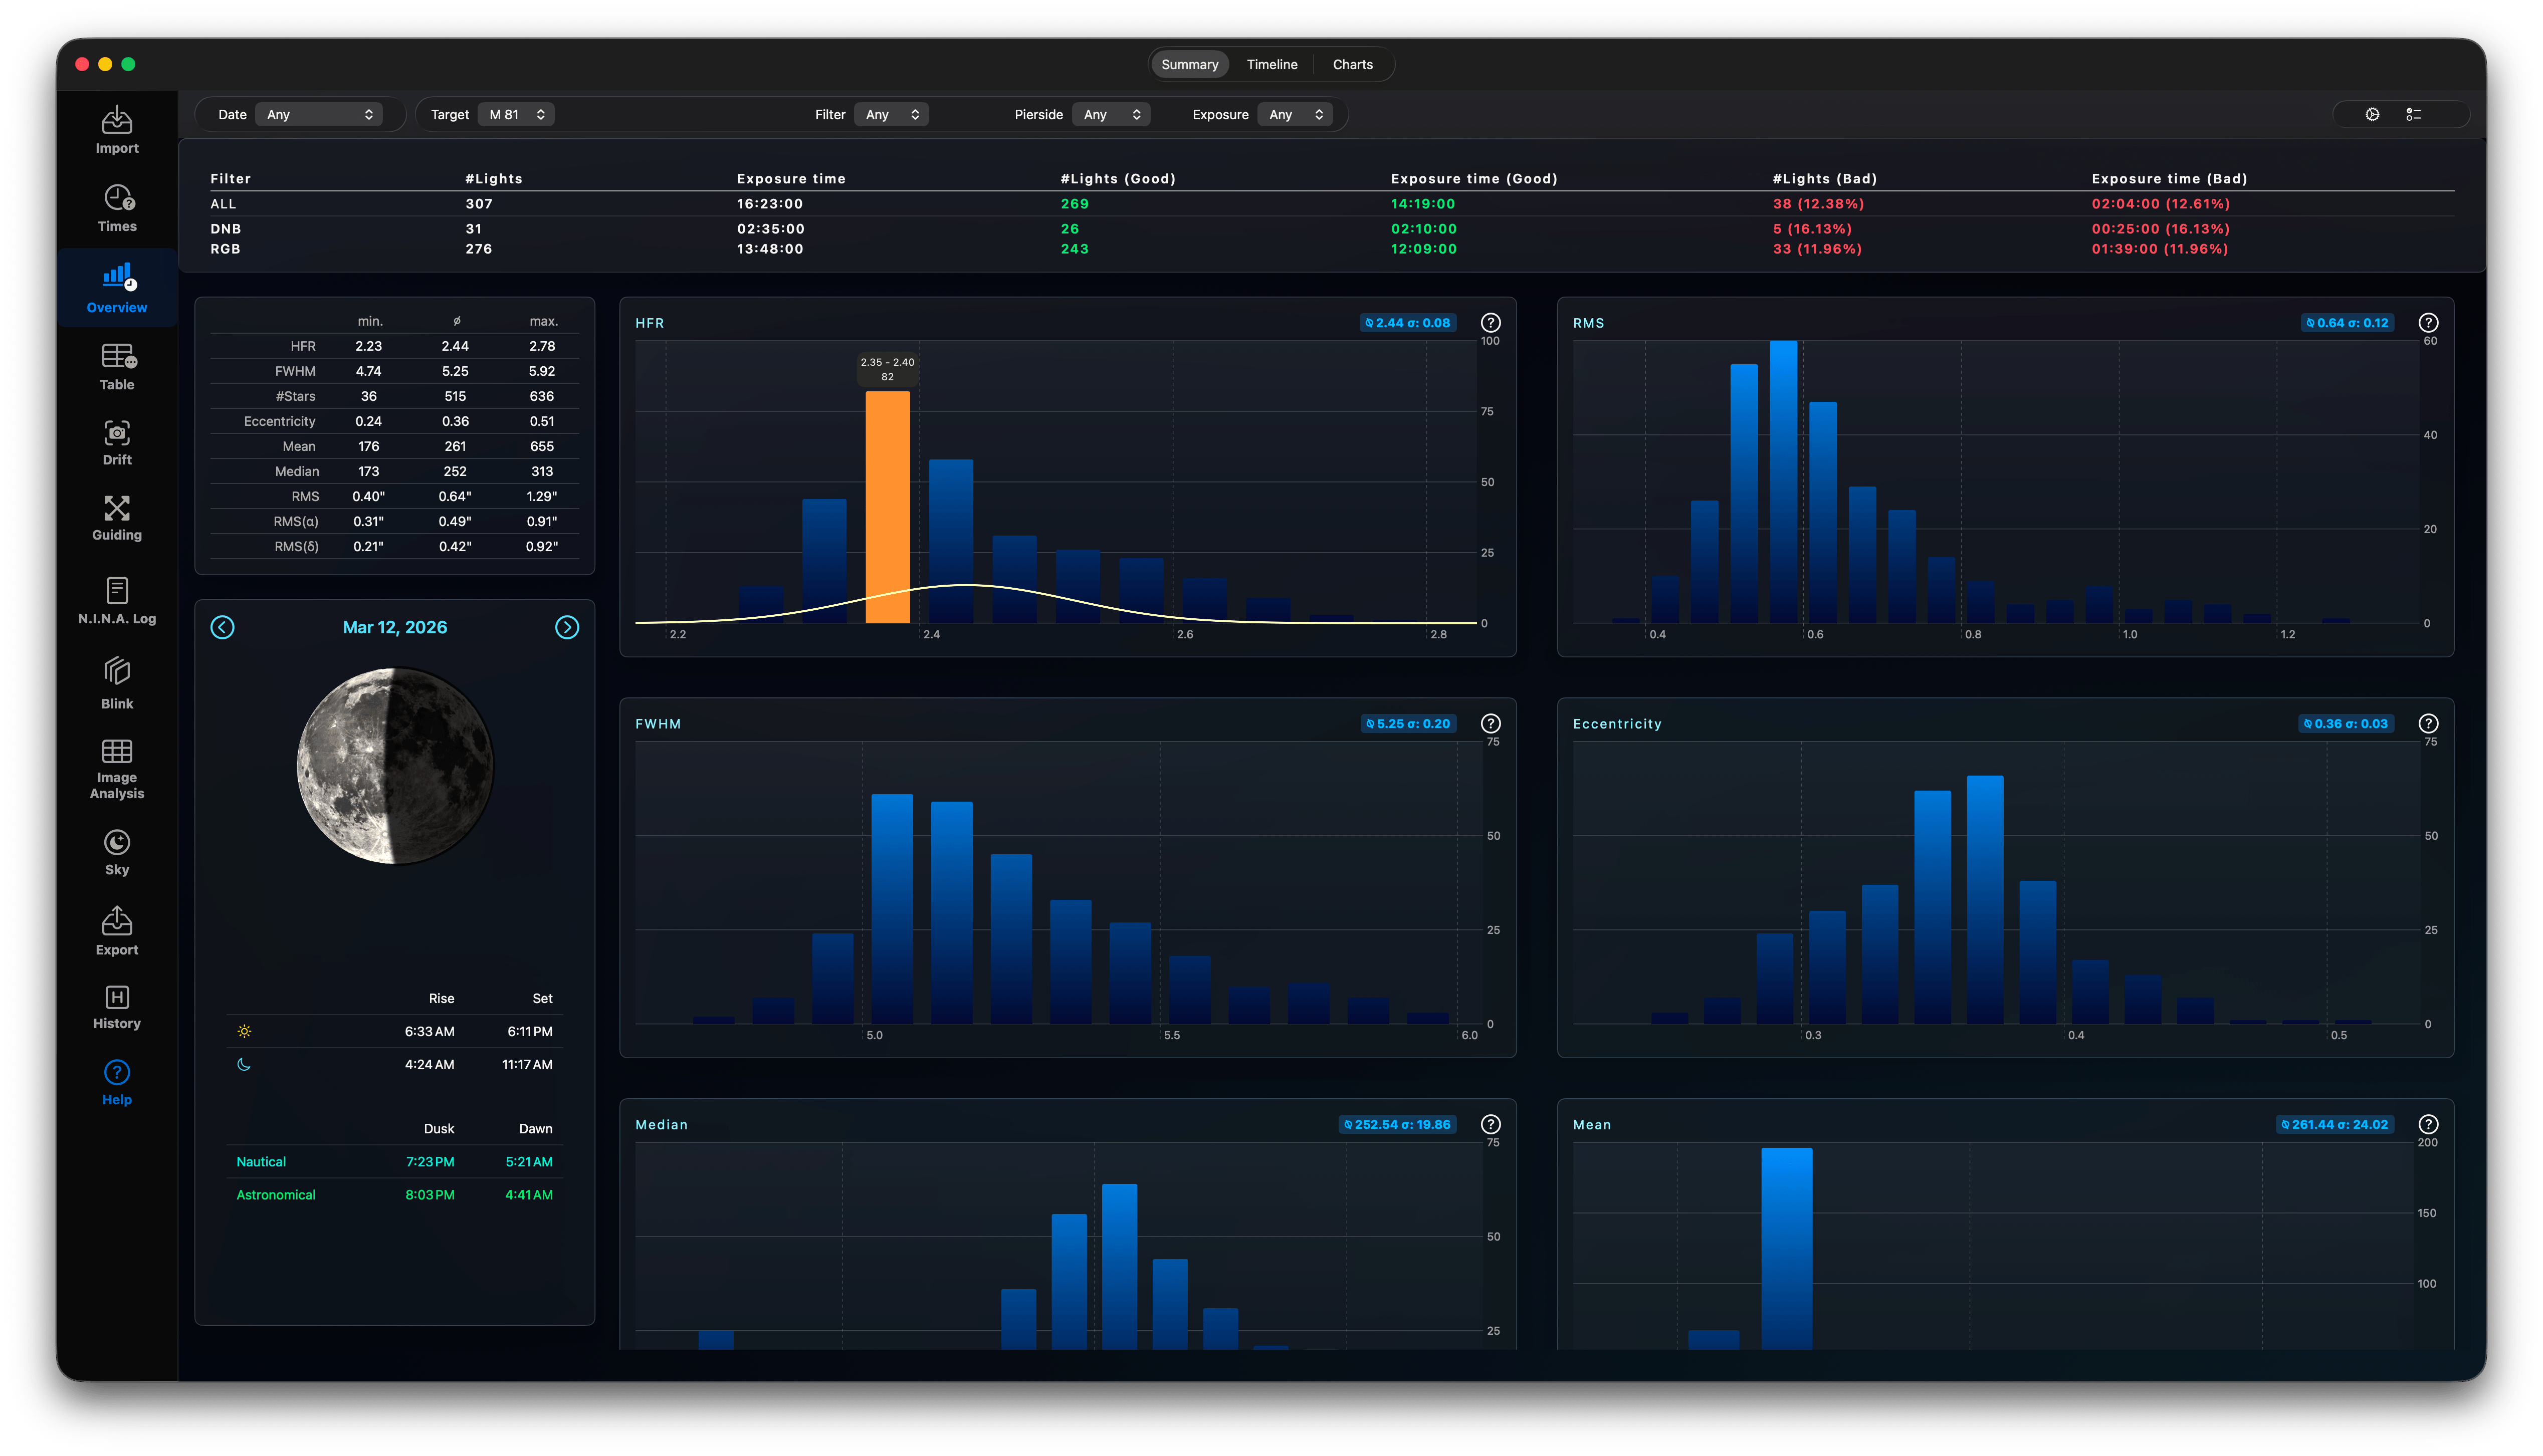
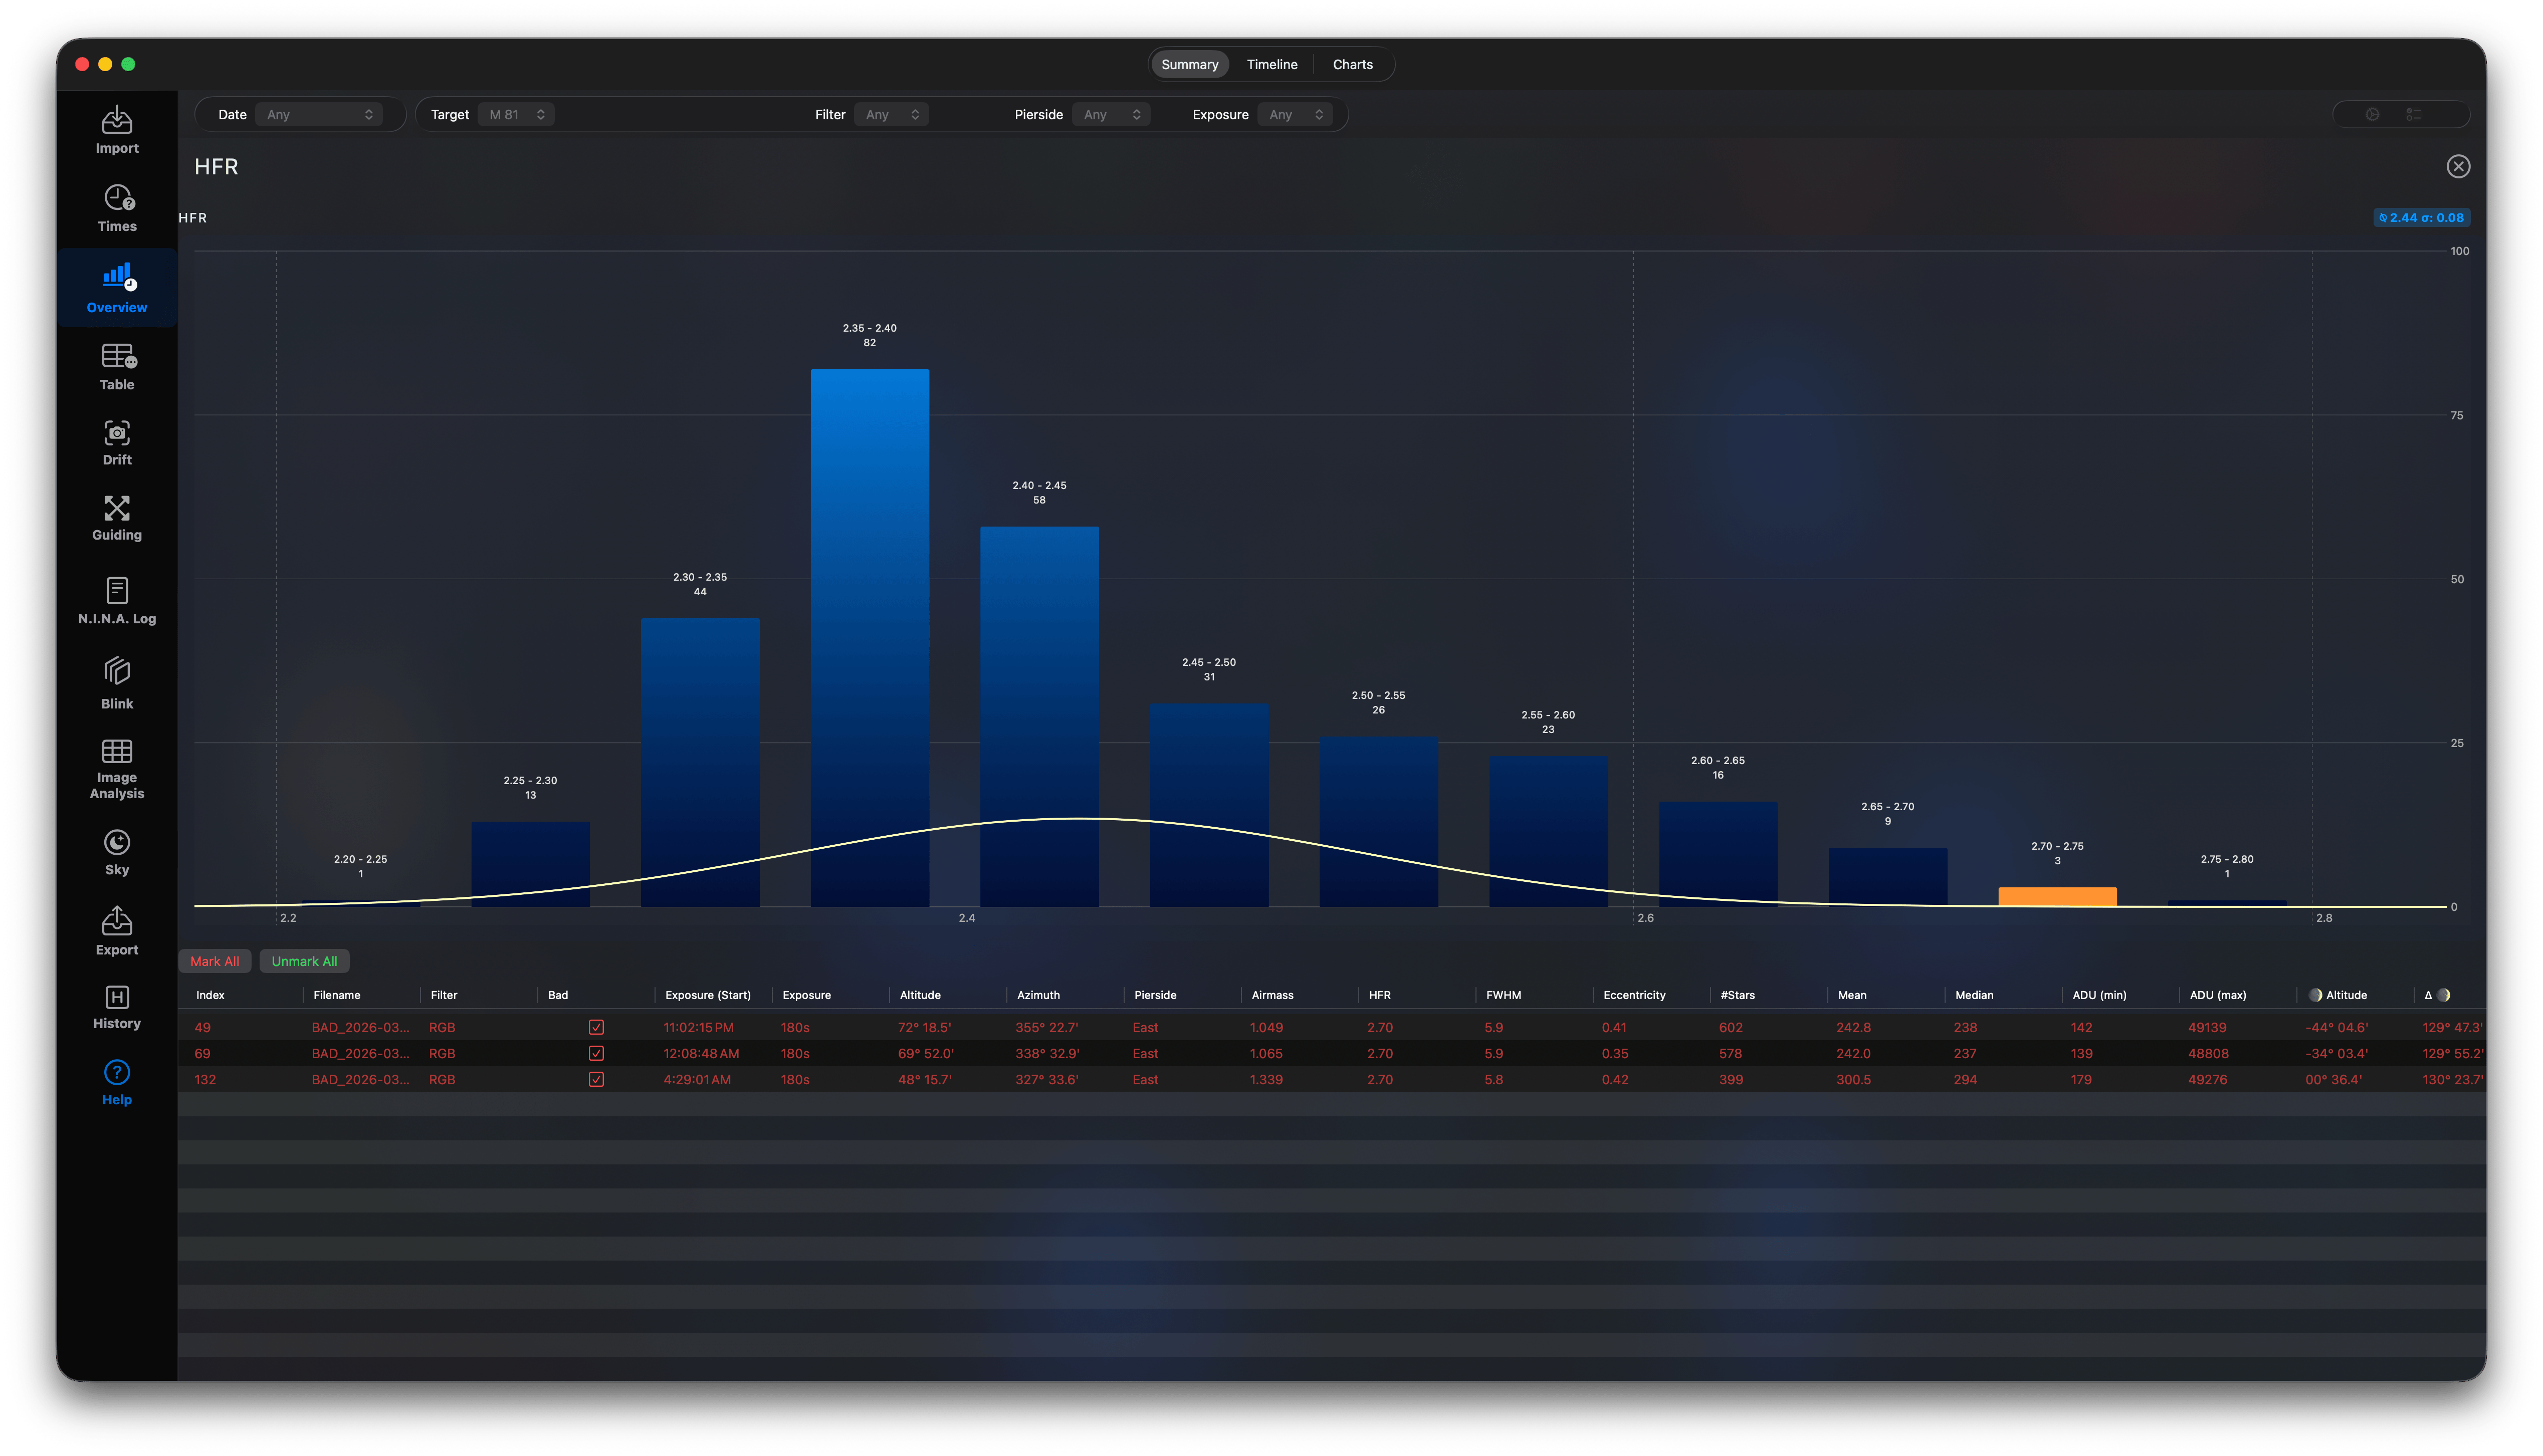
Interaction: - Hovering over a chart displays normal distribution curves. - Clicking any distribution chart expands it to show a detailed histogram of the frames. - Clicking a chart bar shows the list of images in that range. You can mark all frames in a bar as "BAD" simultaneously. - Close this full-size chart with the button on the top-right or using the Escape key.
This gives you a short summary for each session and fast way to exclude some lights with bad quality.
2. Timeline Tab
Plots altitude charts over the course of the night:
- Target Altitude: Visualizes the target's height above the horizon.
- Moon Altitude: Tracks moon positioning and illumination.
- Sun Altitude: Highlights nautical and astronomical twilights.
- Green vertical Line: Autofocus run
- Gray vertical Line: Meridian flip
- Red vertical Line: Interrupted exposure.
- Dots: represent a captured light using the filter color.
If you have captured during multiple nights you can select the night to investigate on top.
Autofocus Diagnostics
Plots autofocus curves retrieved from N.I.N.A. logs: - Shows the V-curve for each autofocus run. - Highlights the starting and final focus positions (yellow dot). - Displays pre- and post-focus HFR values to verify if focus was improved. - Lists HFR metrics of the last five frames before and first five frames after focus to verify autofocus efficacy.\n
Focuser Chart
Plots the Focuser Position, the HFR values, the Focuser temperature or ambient temperature and the Autofocus runs in one chart.
- Green: Focuser Position
- Cyan: HFR
- Magenta: Ambient Temperature
- Pink: Focuser Temperature (if available)
- Yellow: Number of Stars in the lights
- Gray: ADU Mean Value of the lights
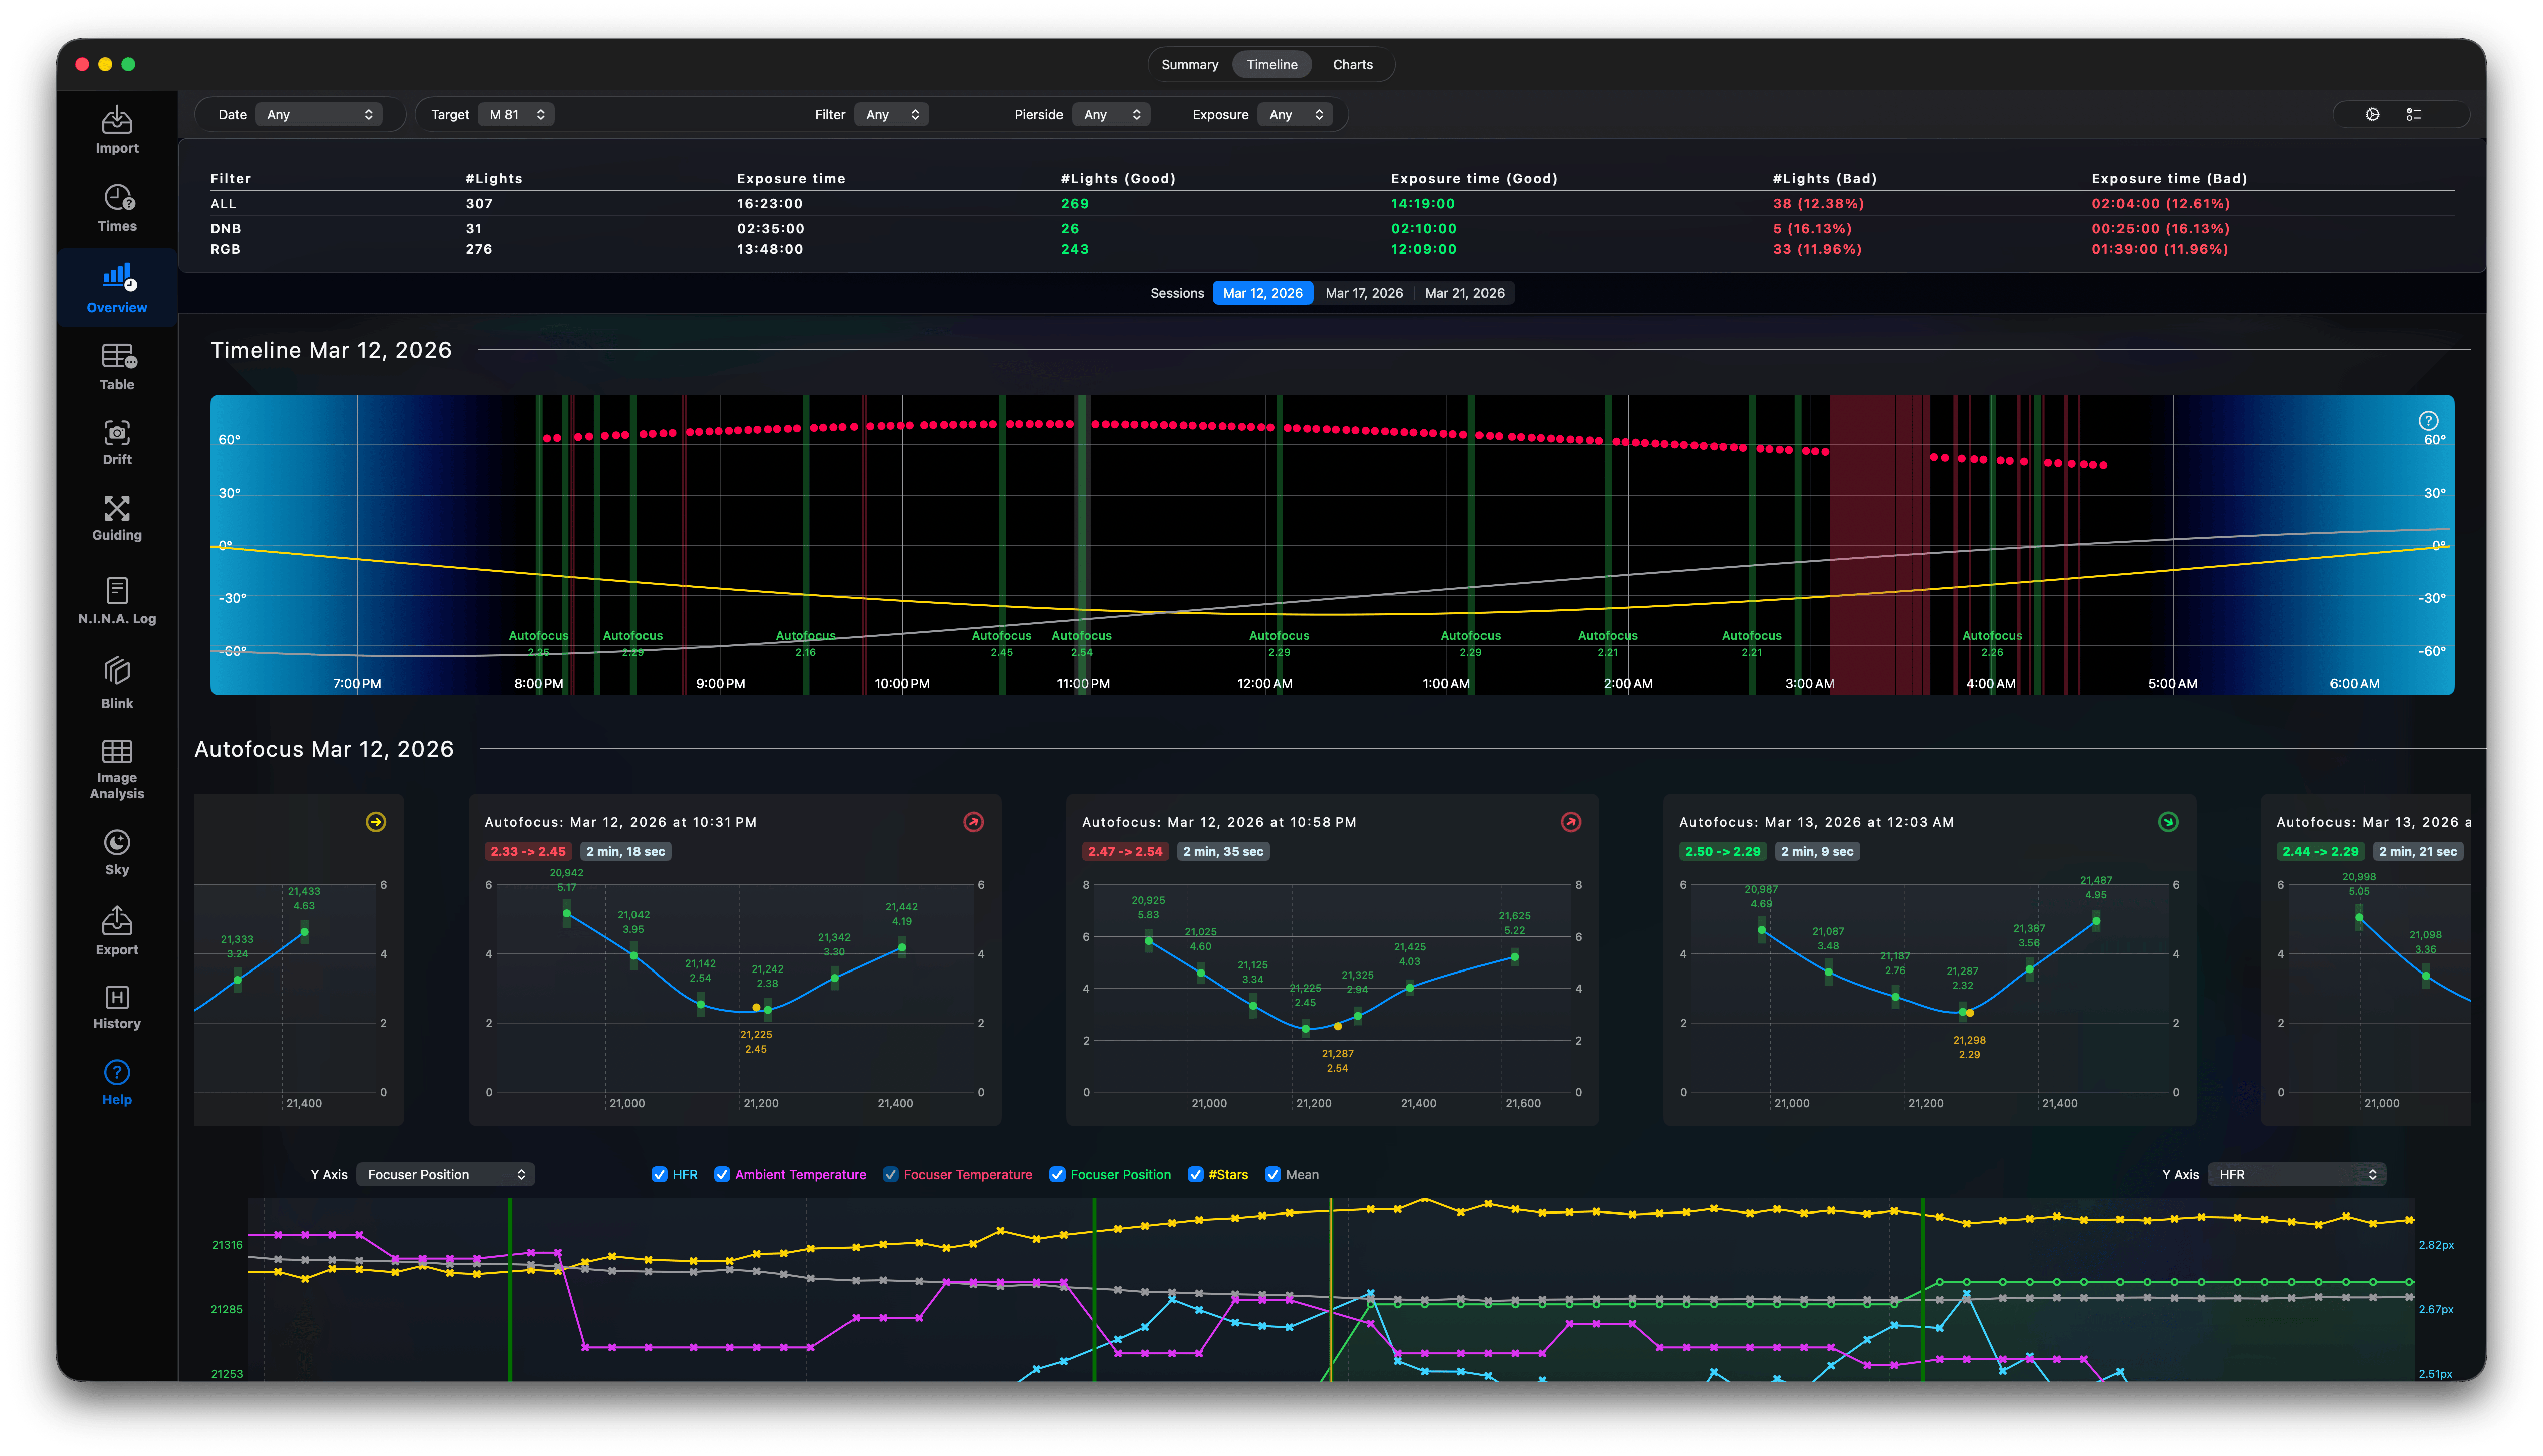
The charts in this view are interactive. You can move the cursor over the altitude chart and hover over one of the vertical lines. If you select one the green lines, the corresponding Autofocus chart will be highlighted (green) and the Focuser Position chart will highlight the lights captured using this Autofocus run, so you can see the HFR change.
Using these interactive charts you can check, if:
- Your Autofocus works properly over the entire night. Check the V-curves.
- If your Autofocus always improves the HFR values!
- If your temperature settings are good enough or need to be improved.
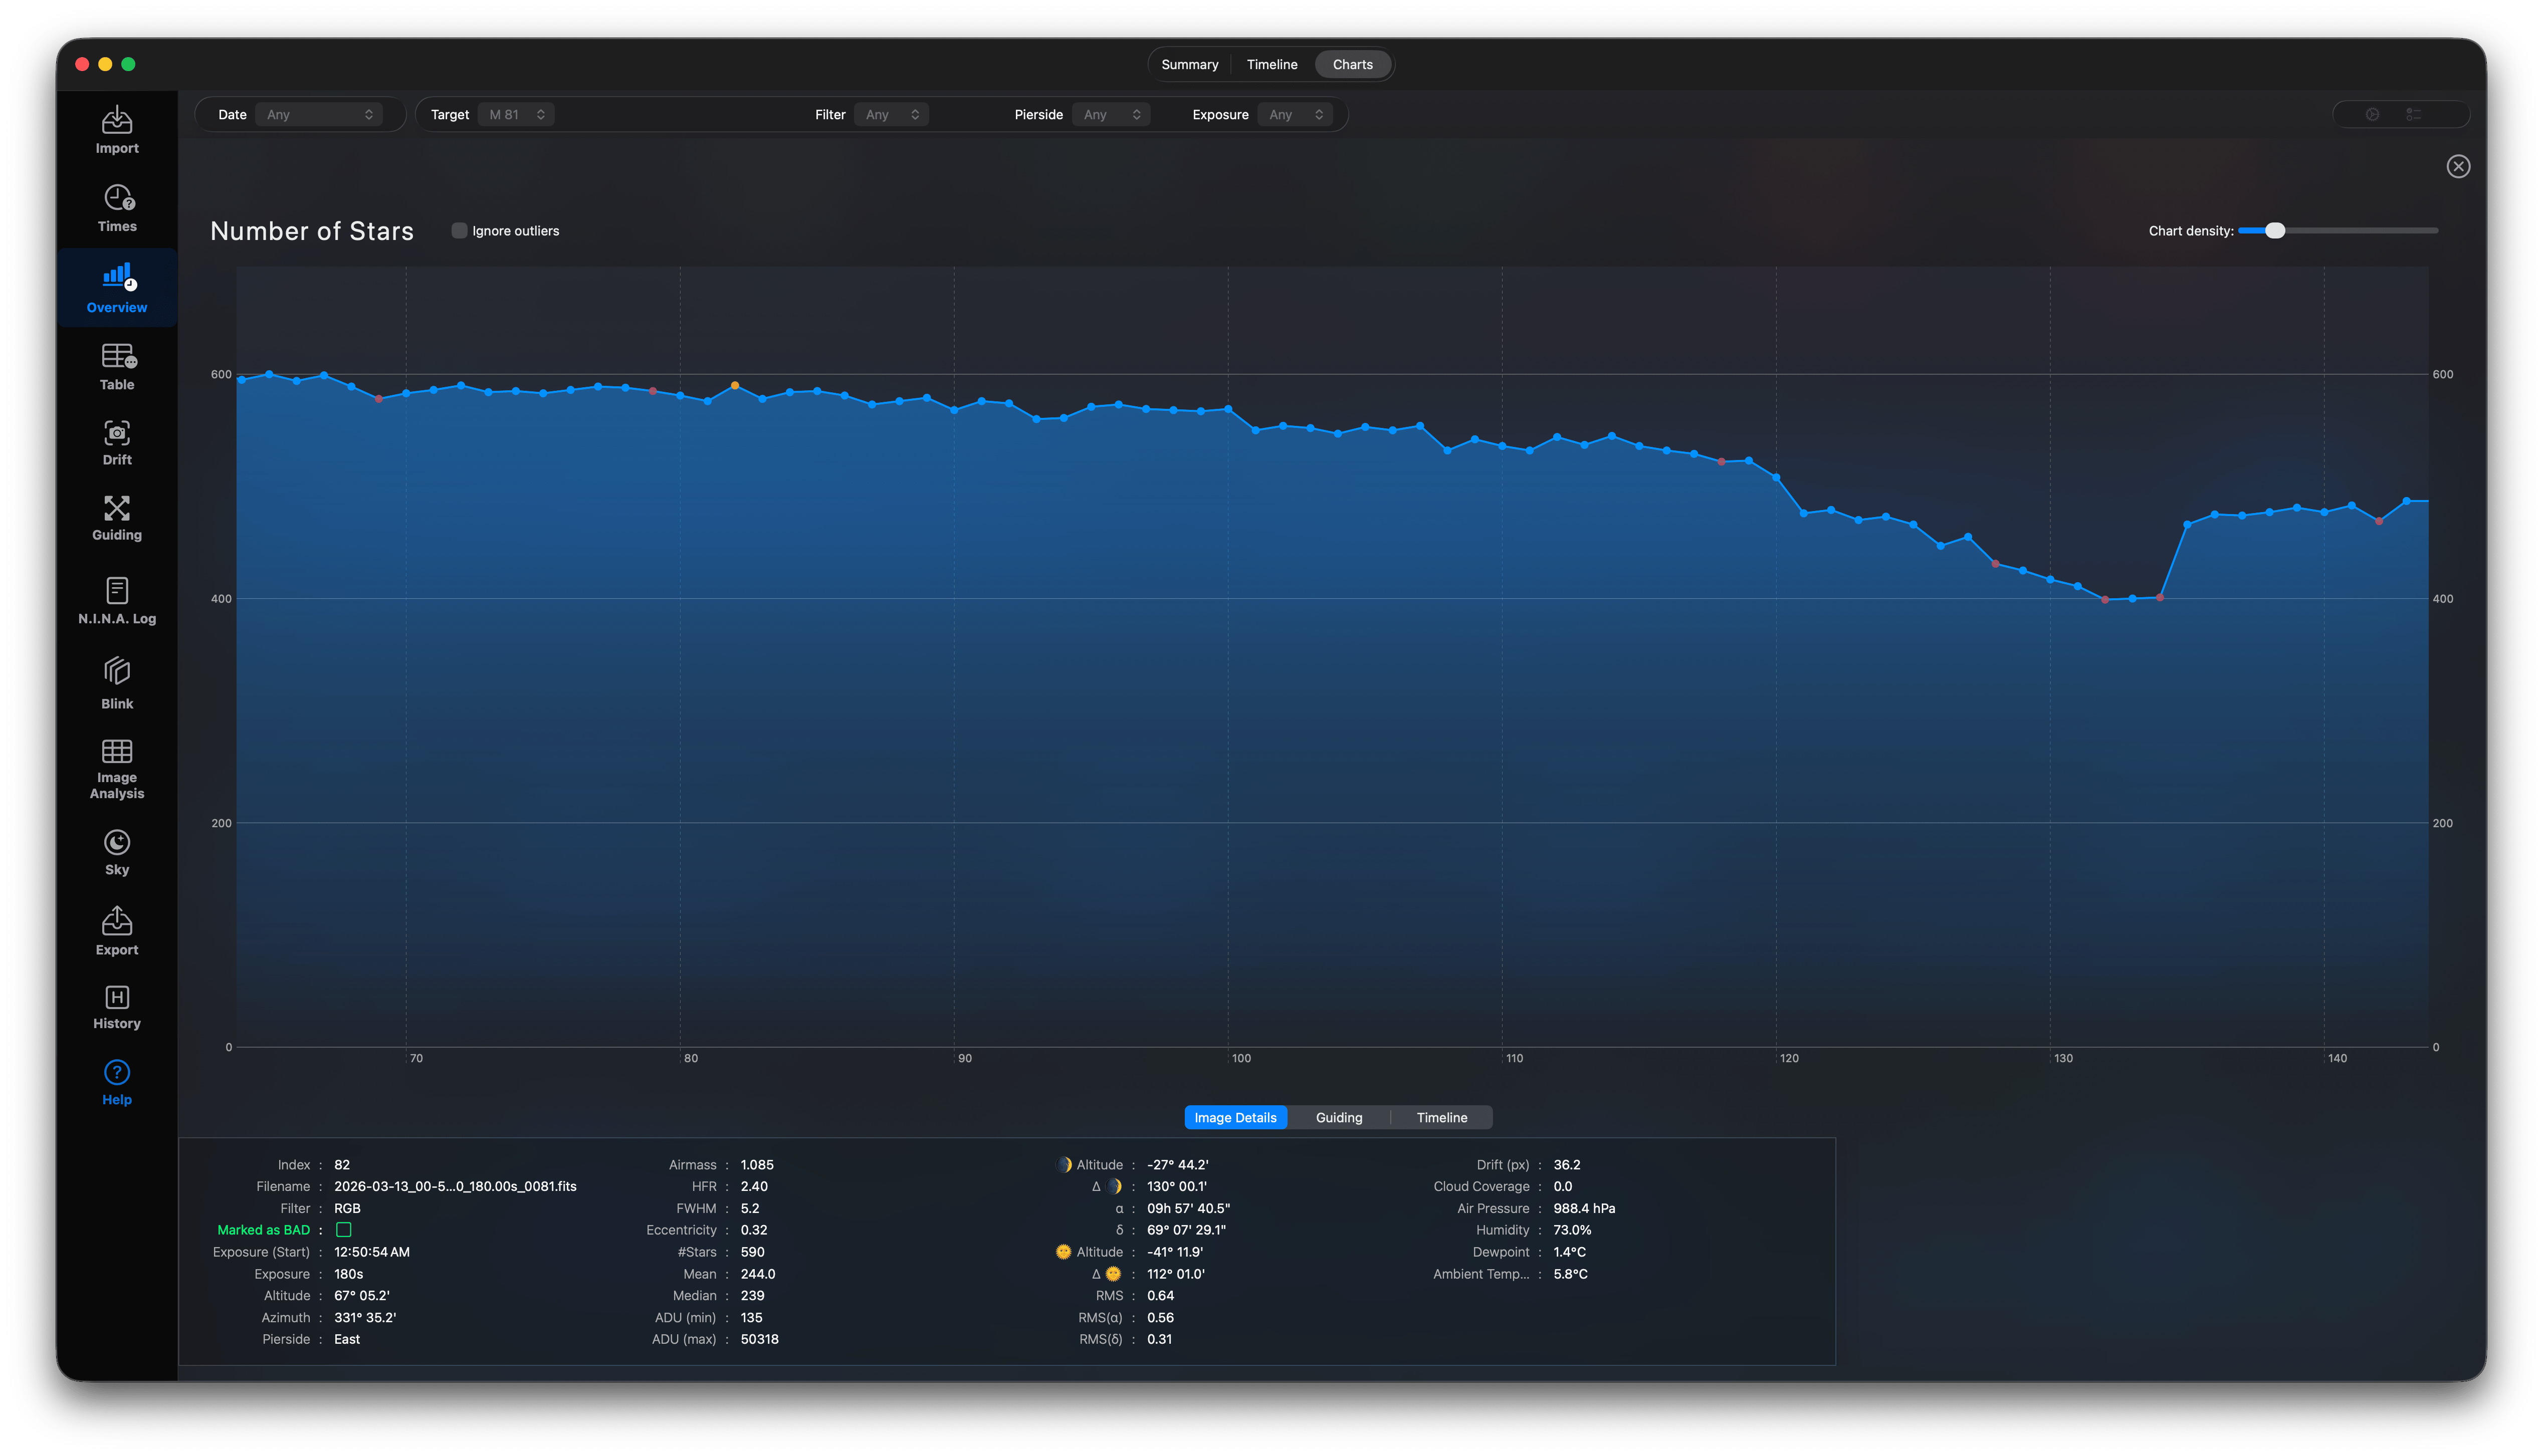
3. Charts Tab
Allows plotting custom dual-axis charts to find correlations (e.g., plotting HFR against guiding RMS or Temperature). * Toggle active charts in the sidebar using Chart Selector. * Click on a chart to see in full-size.
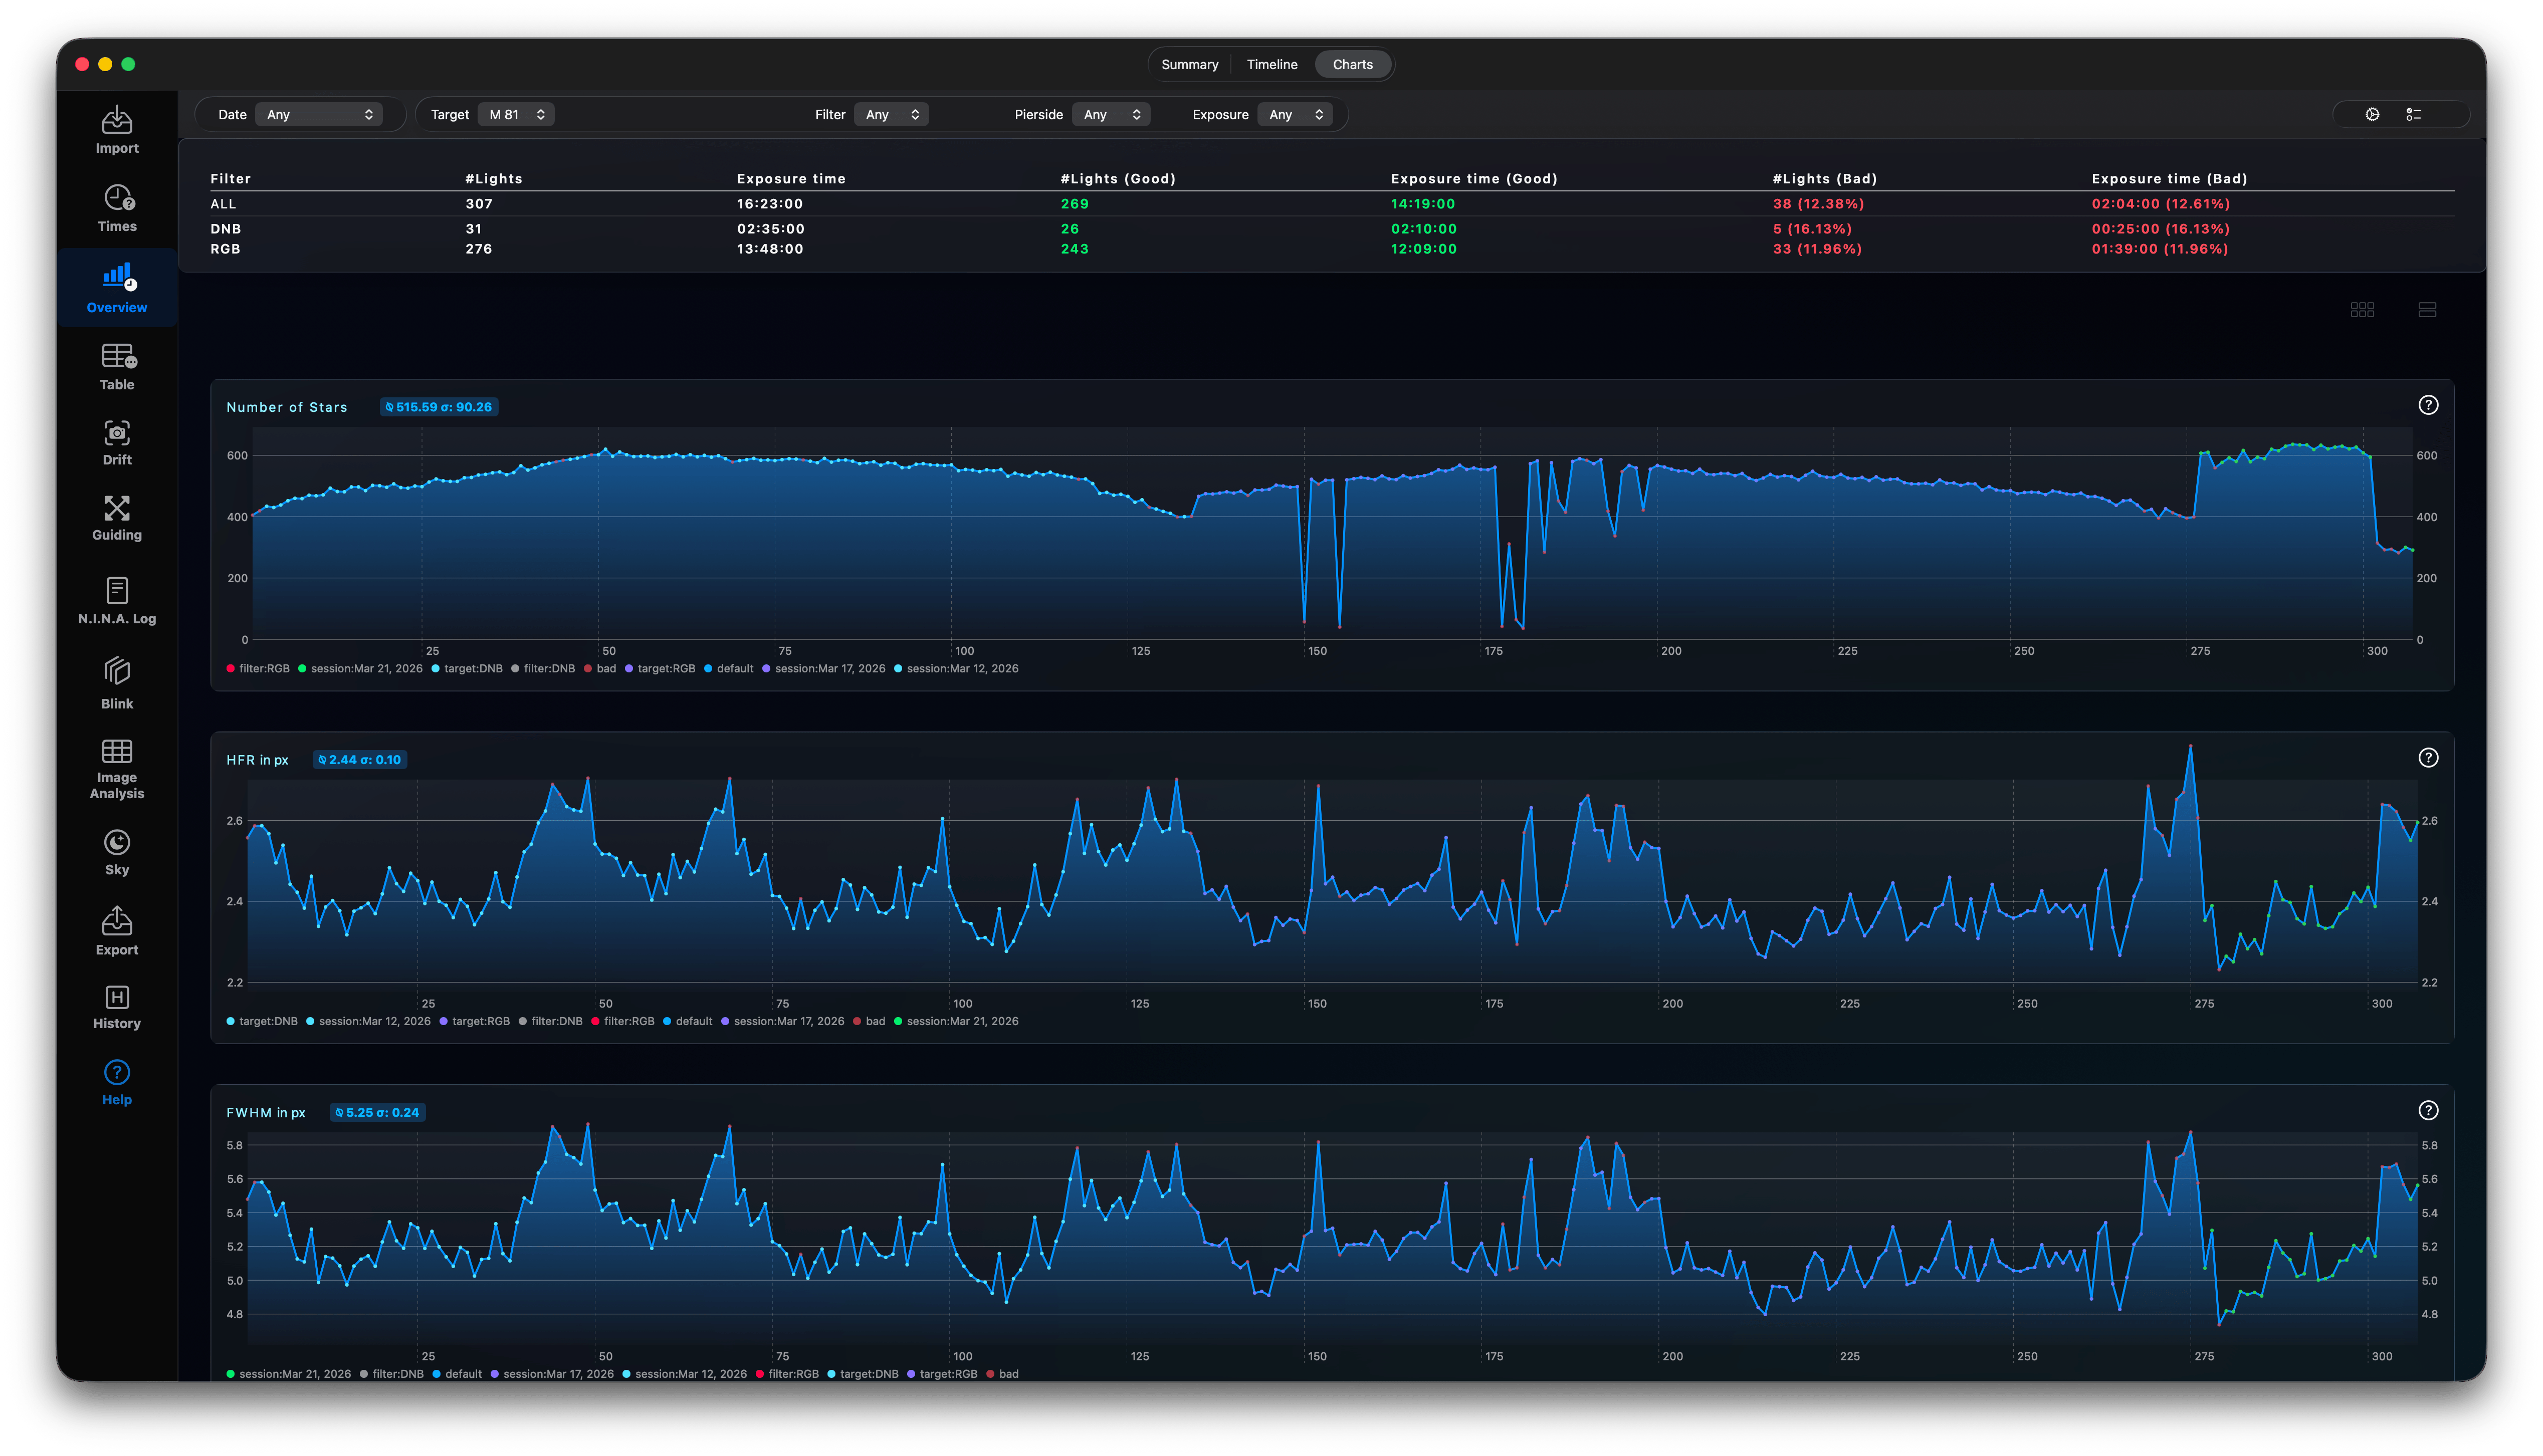
Each chart shows the mean value of all values and the standard deviation in the header in blue. Move the cursor over a chart and hover over one light to see more details, or click on the chart to show it in full-size.
Here you can select on of the dots and see more details.
Image Details
The image details shoe several metadata for this light. You can mark this special light as BAD or unmark it if needed.
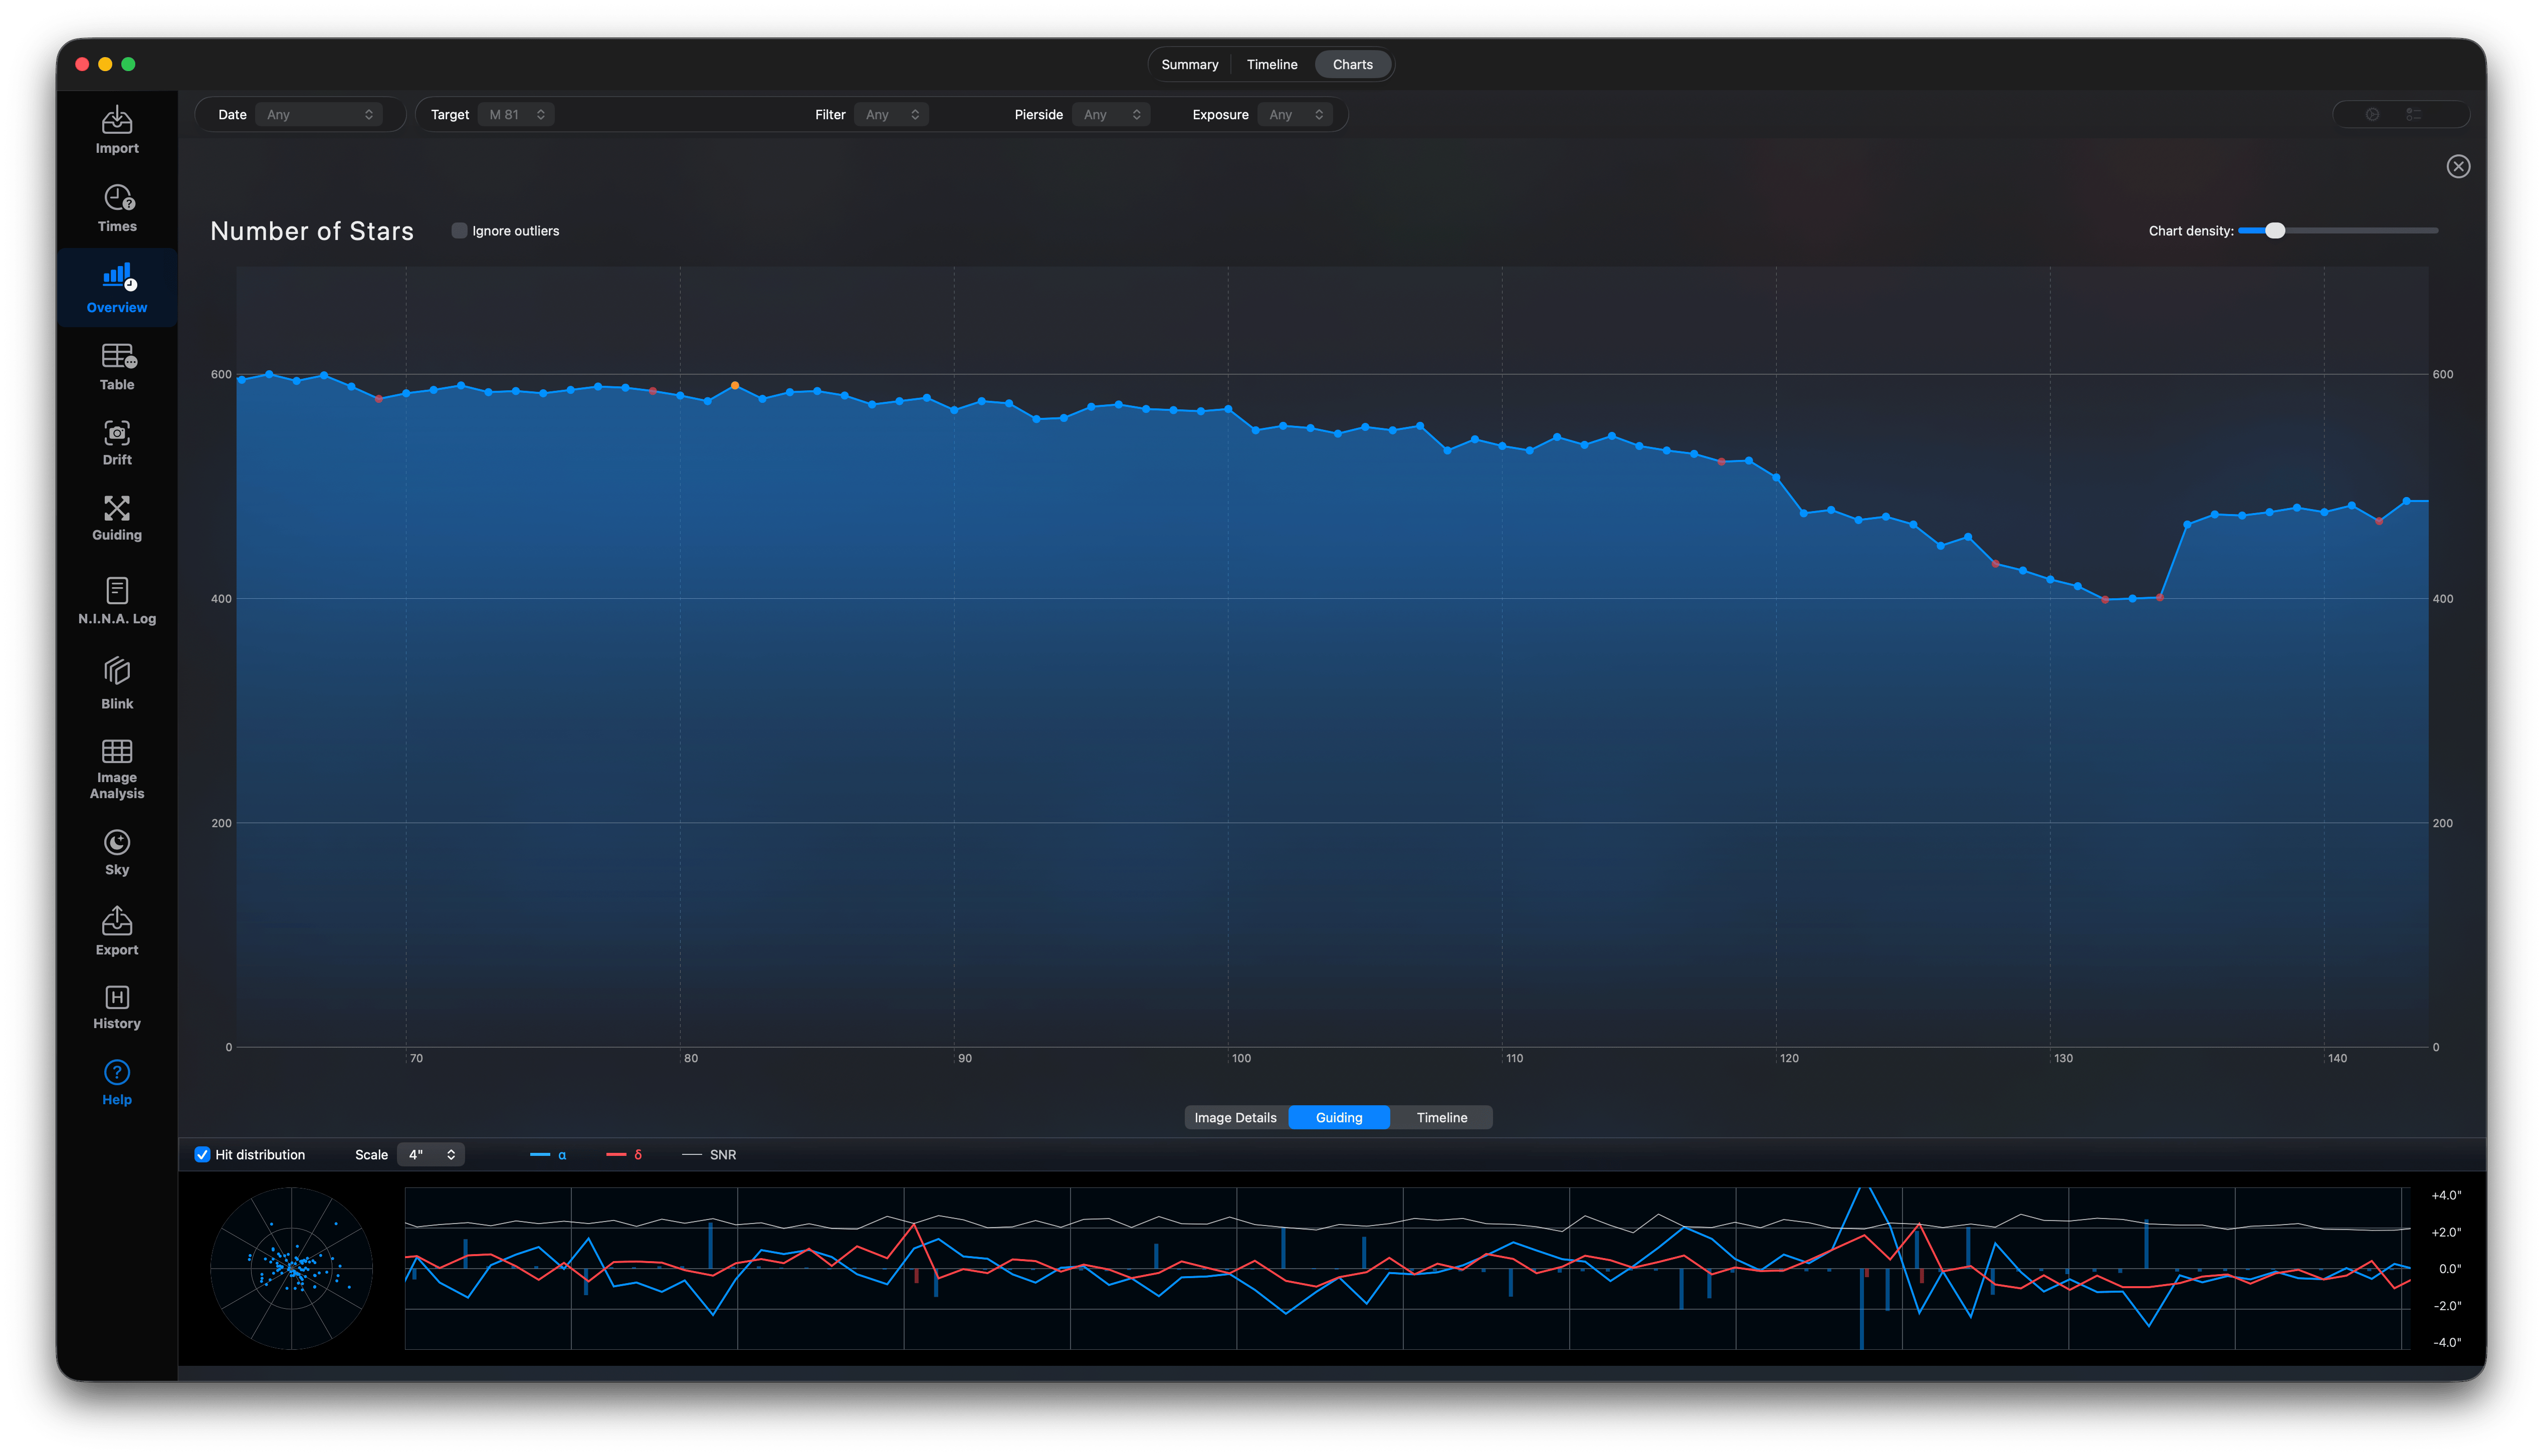
Guiding
The guiding show the guide chart for this light.
TimeLine
The timeline shows the selected lights in the altitude chart for this night.
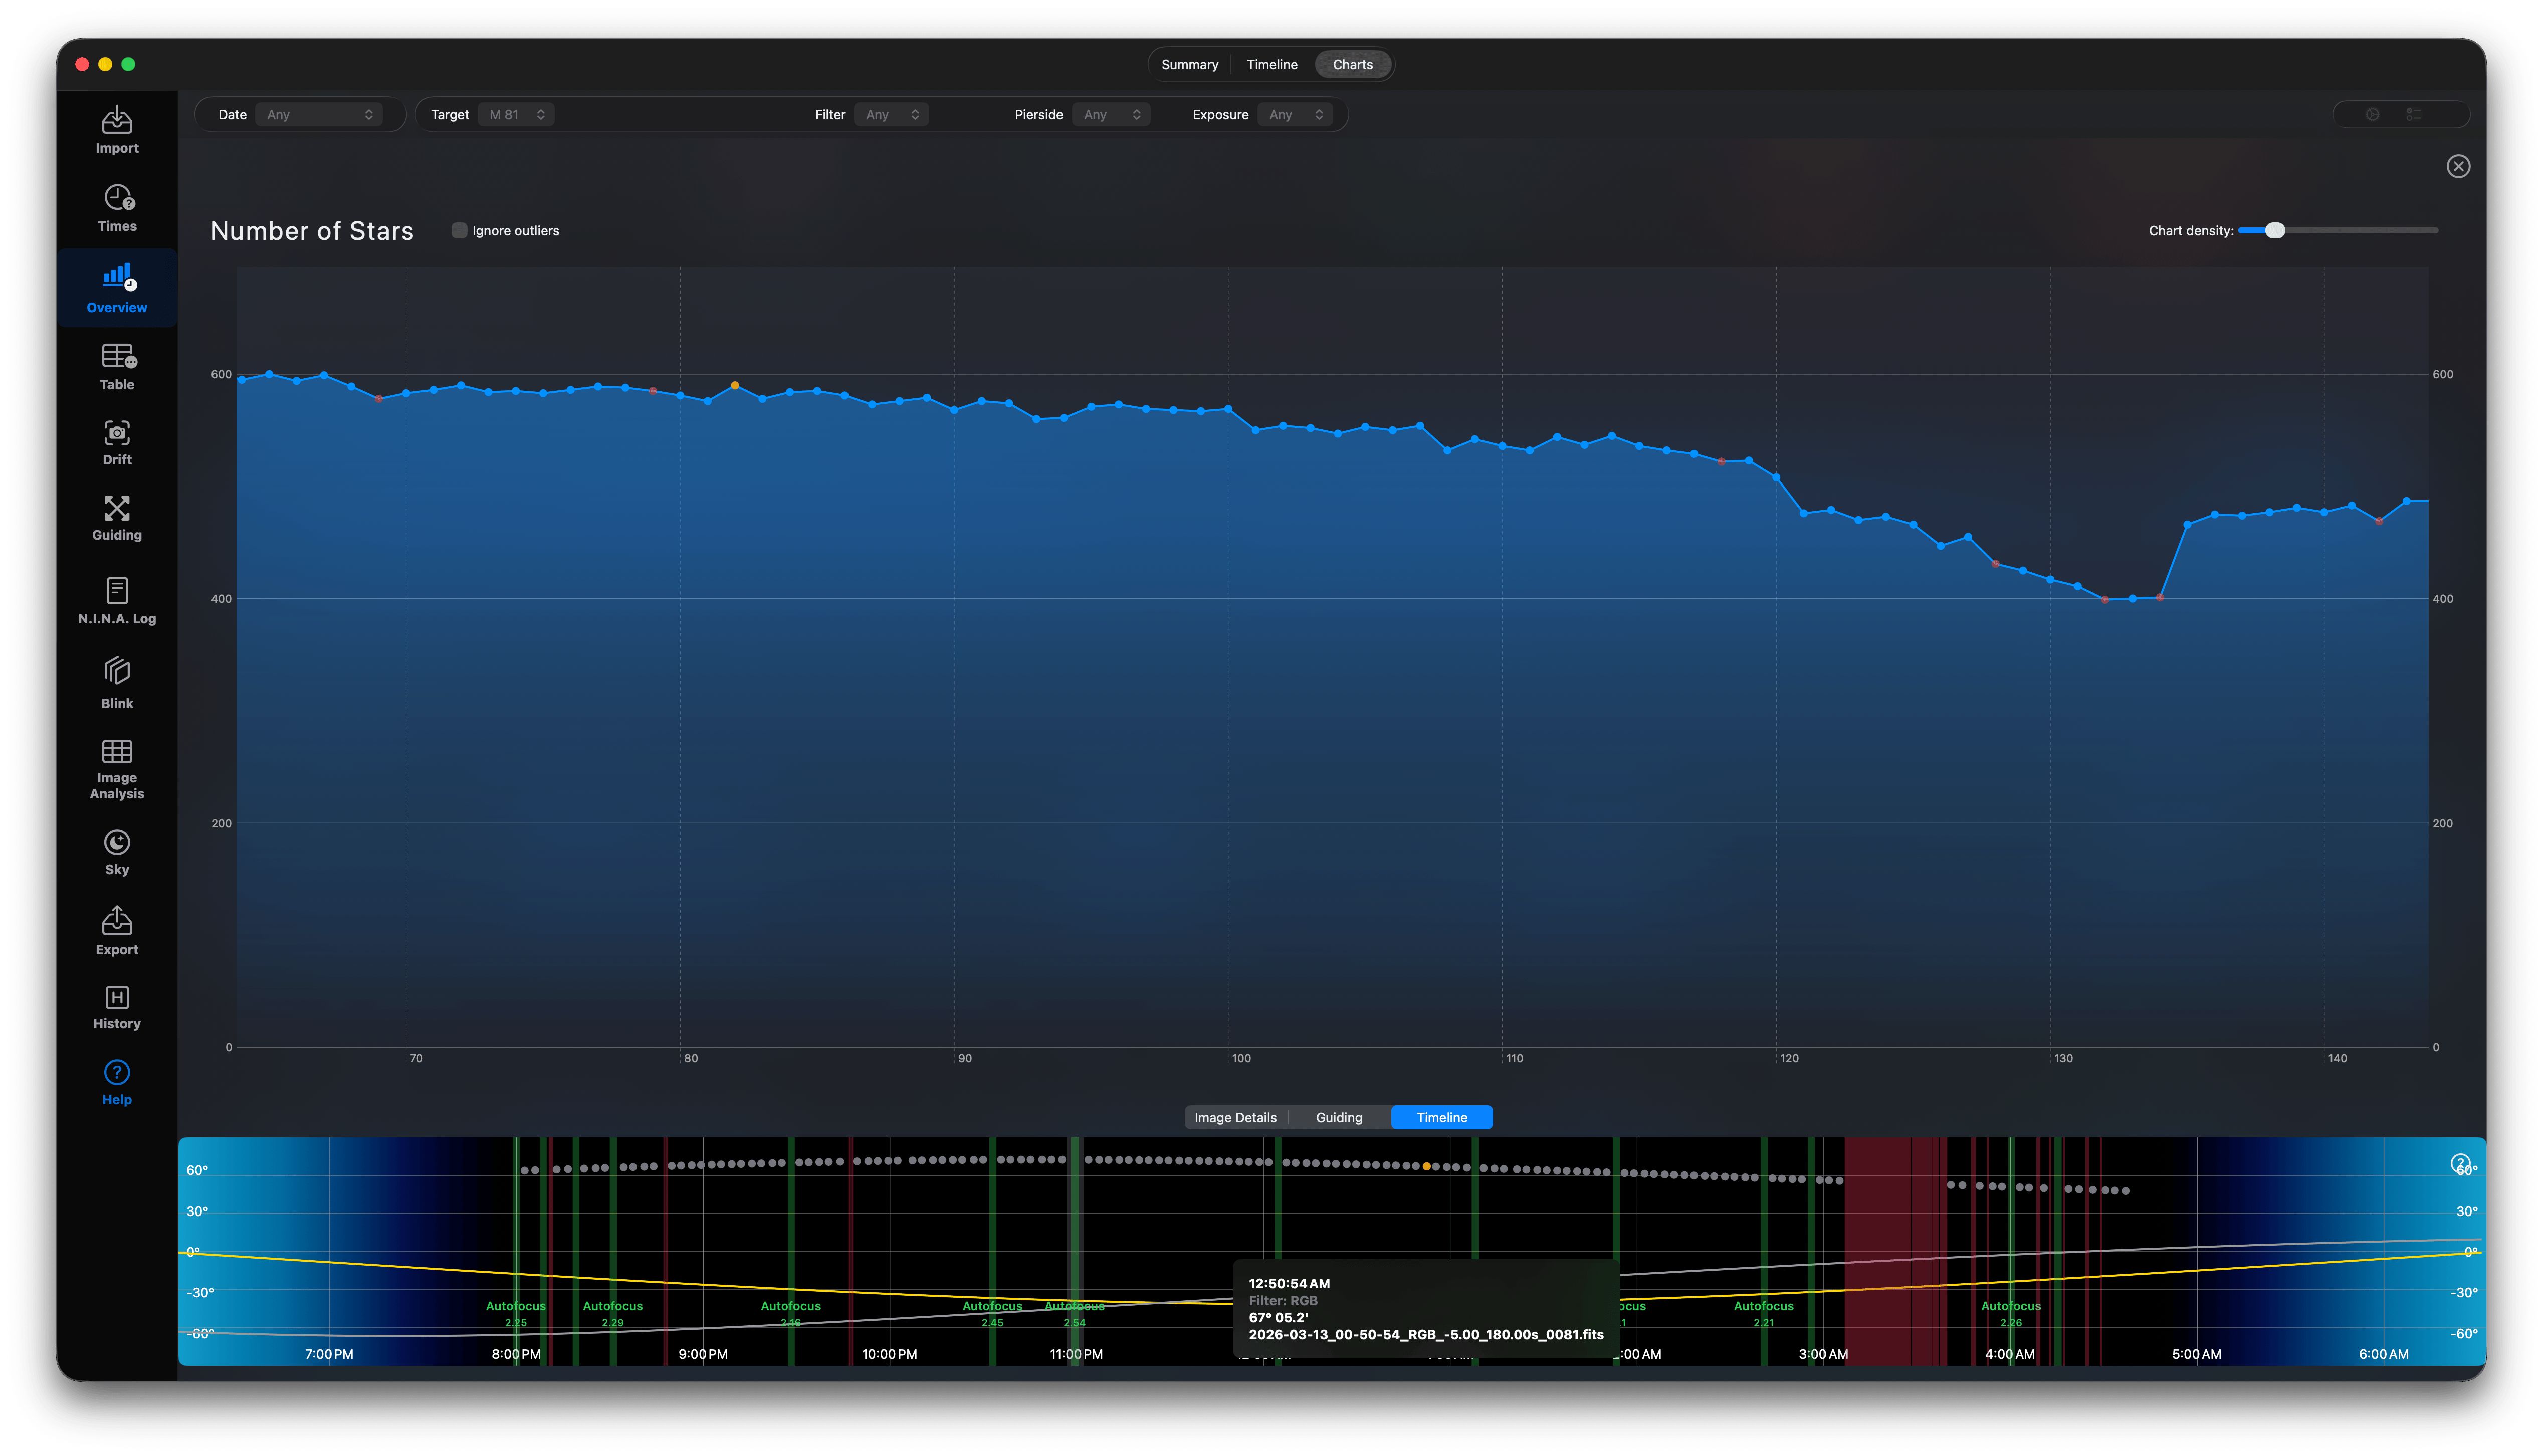
Close the Chart details using the Escape key or the button on the top right.