Guiding (PHD2 Analytics)
The Guiding view displays guide logs parsed from PHD2 graphically.
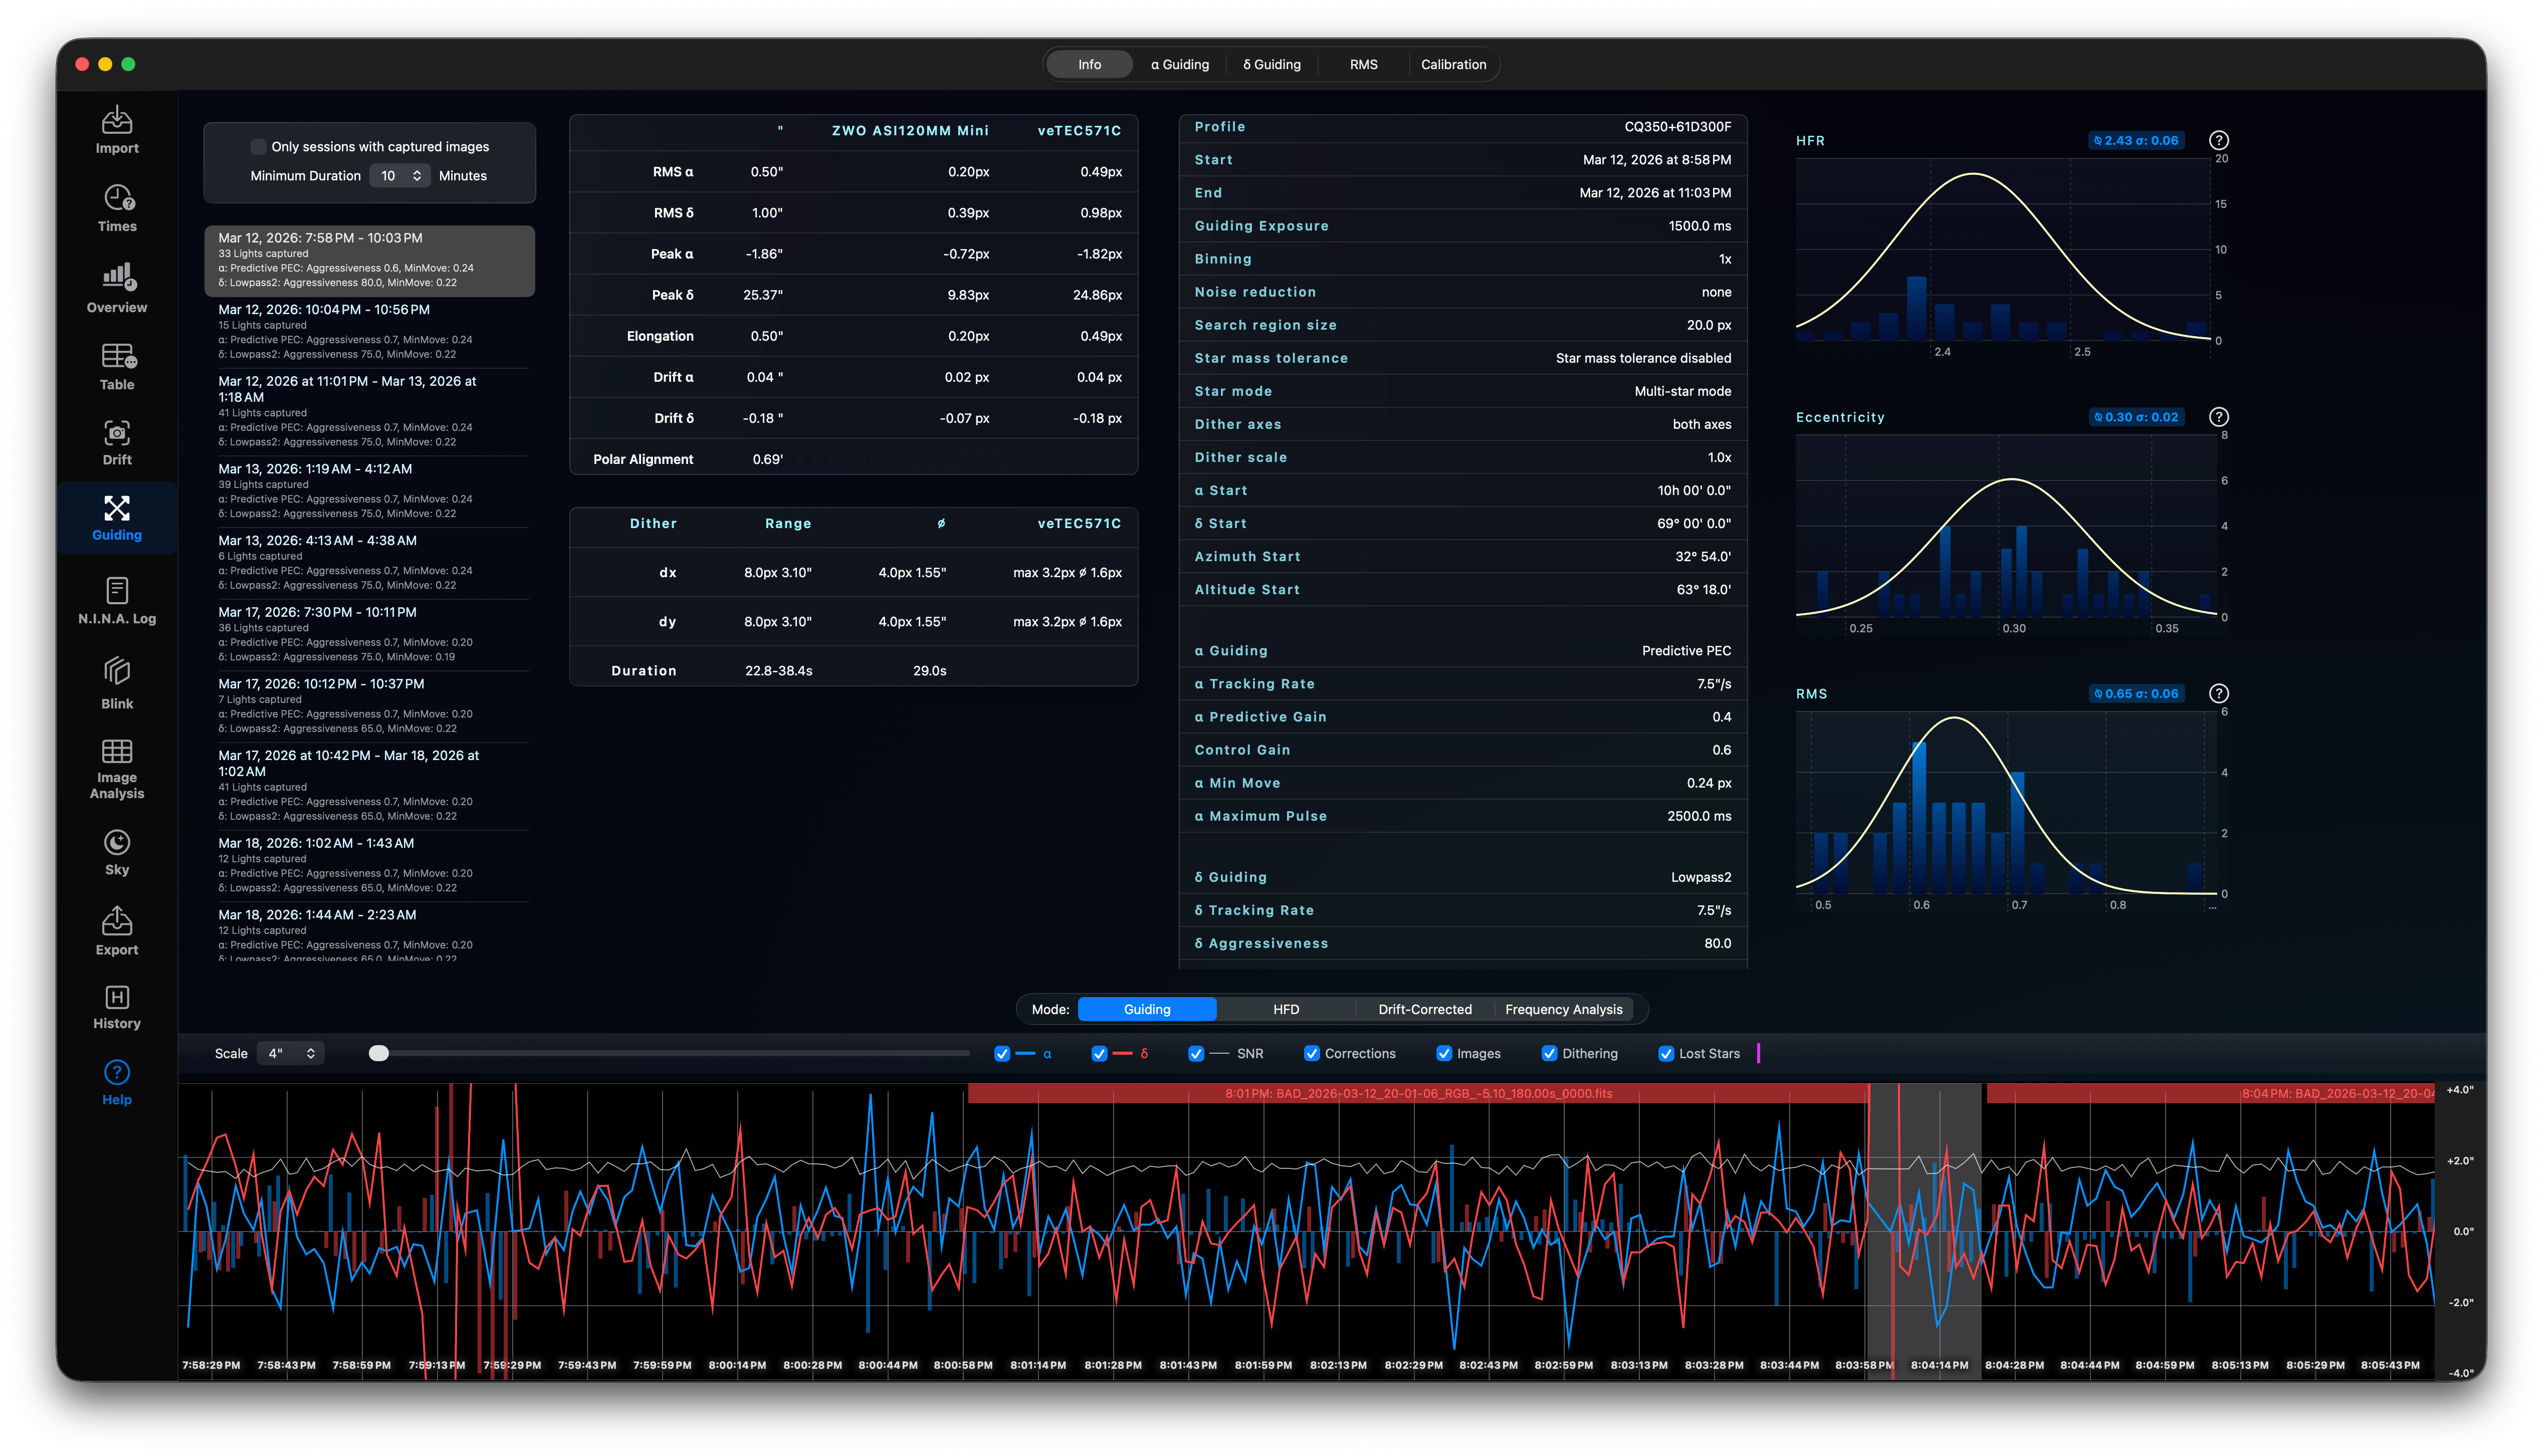
Info
PHD2 creates multiple guiding sessions in the log, which can be selected on the left side. You can filter to see just the guiding sessions with captured images and you can define the minimum duration of such a session, i.e. 10 minutes or longer.
The info tab shows all guiding parameters and summarises all Guiding values of this session. It also contains an estimated Polar Alignment error based on the drift data in PHD2.
On the right-hand side you find some charts for the lights HFR, Eccentricity and Guiding RMS, only using the lights captured during the PHD2 Guiding session.
Below you find the guiding chart. On the chart top line you see the time ranges for captured lights. The guiding chart is identical to the one used in PHD2.
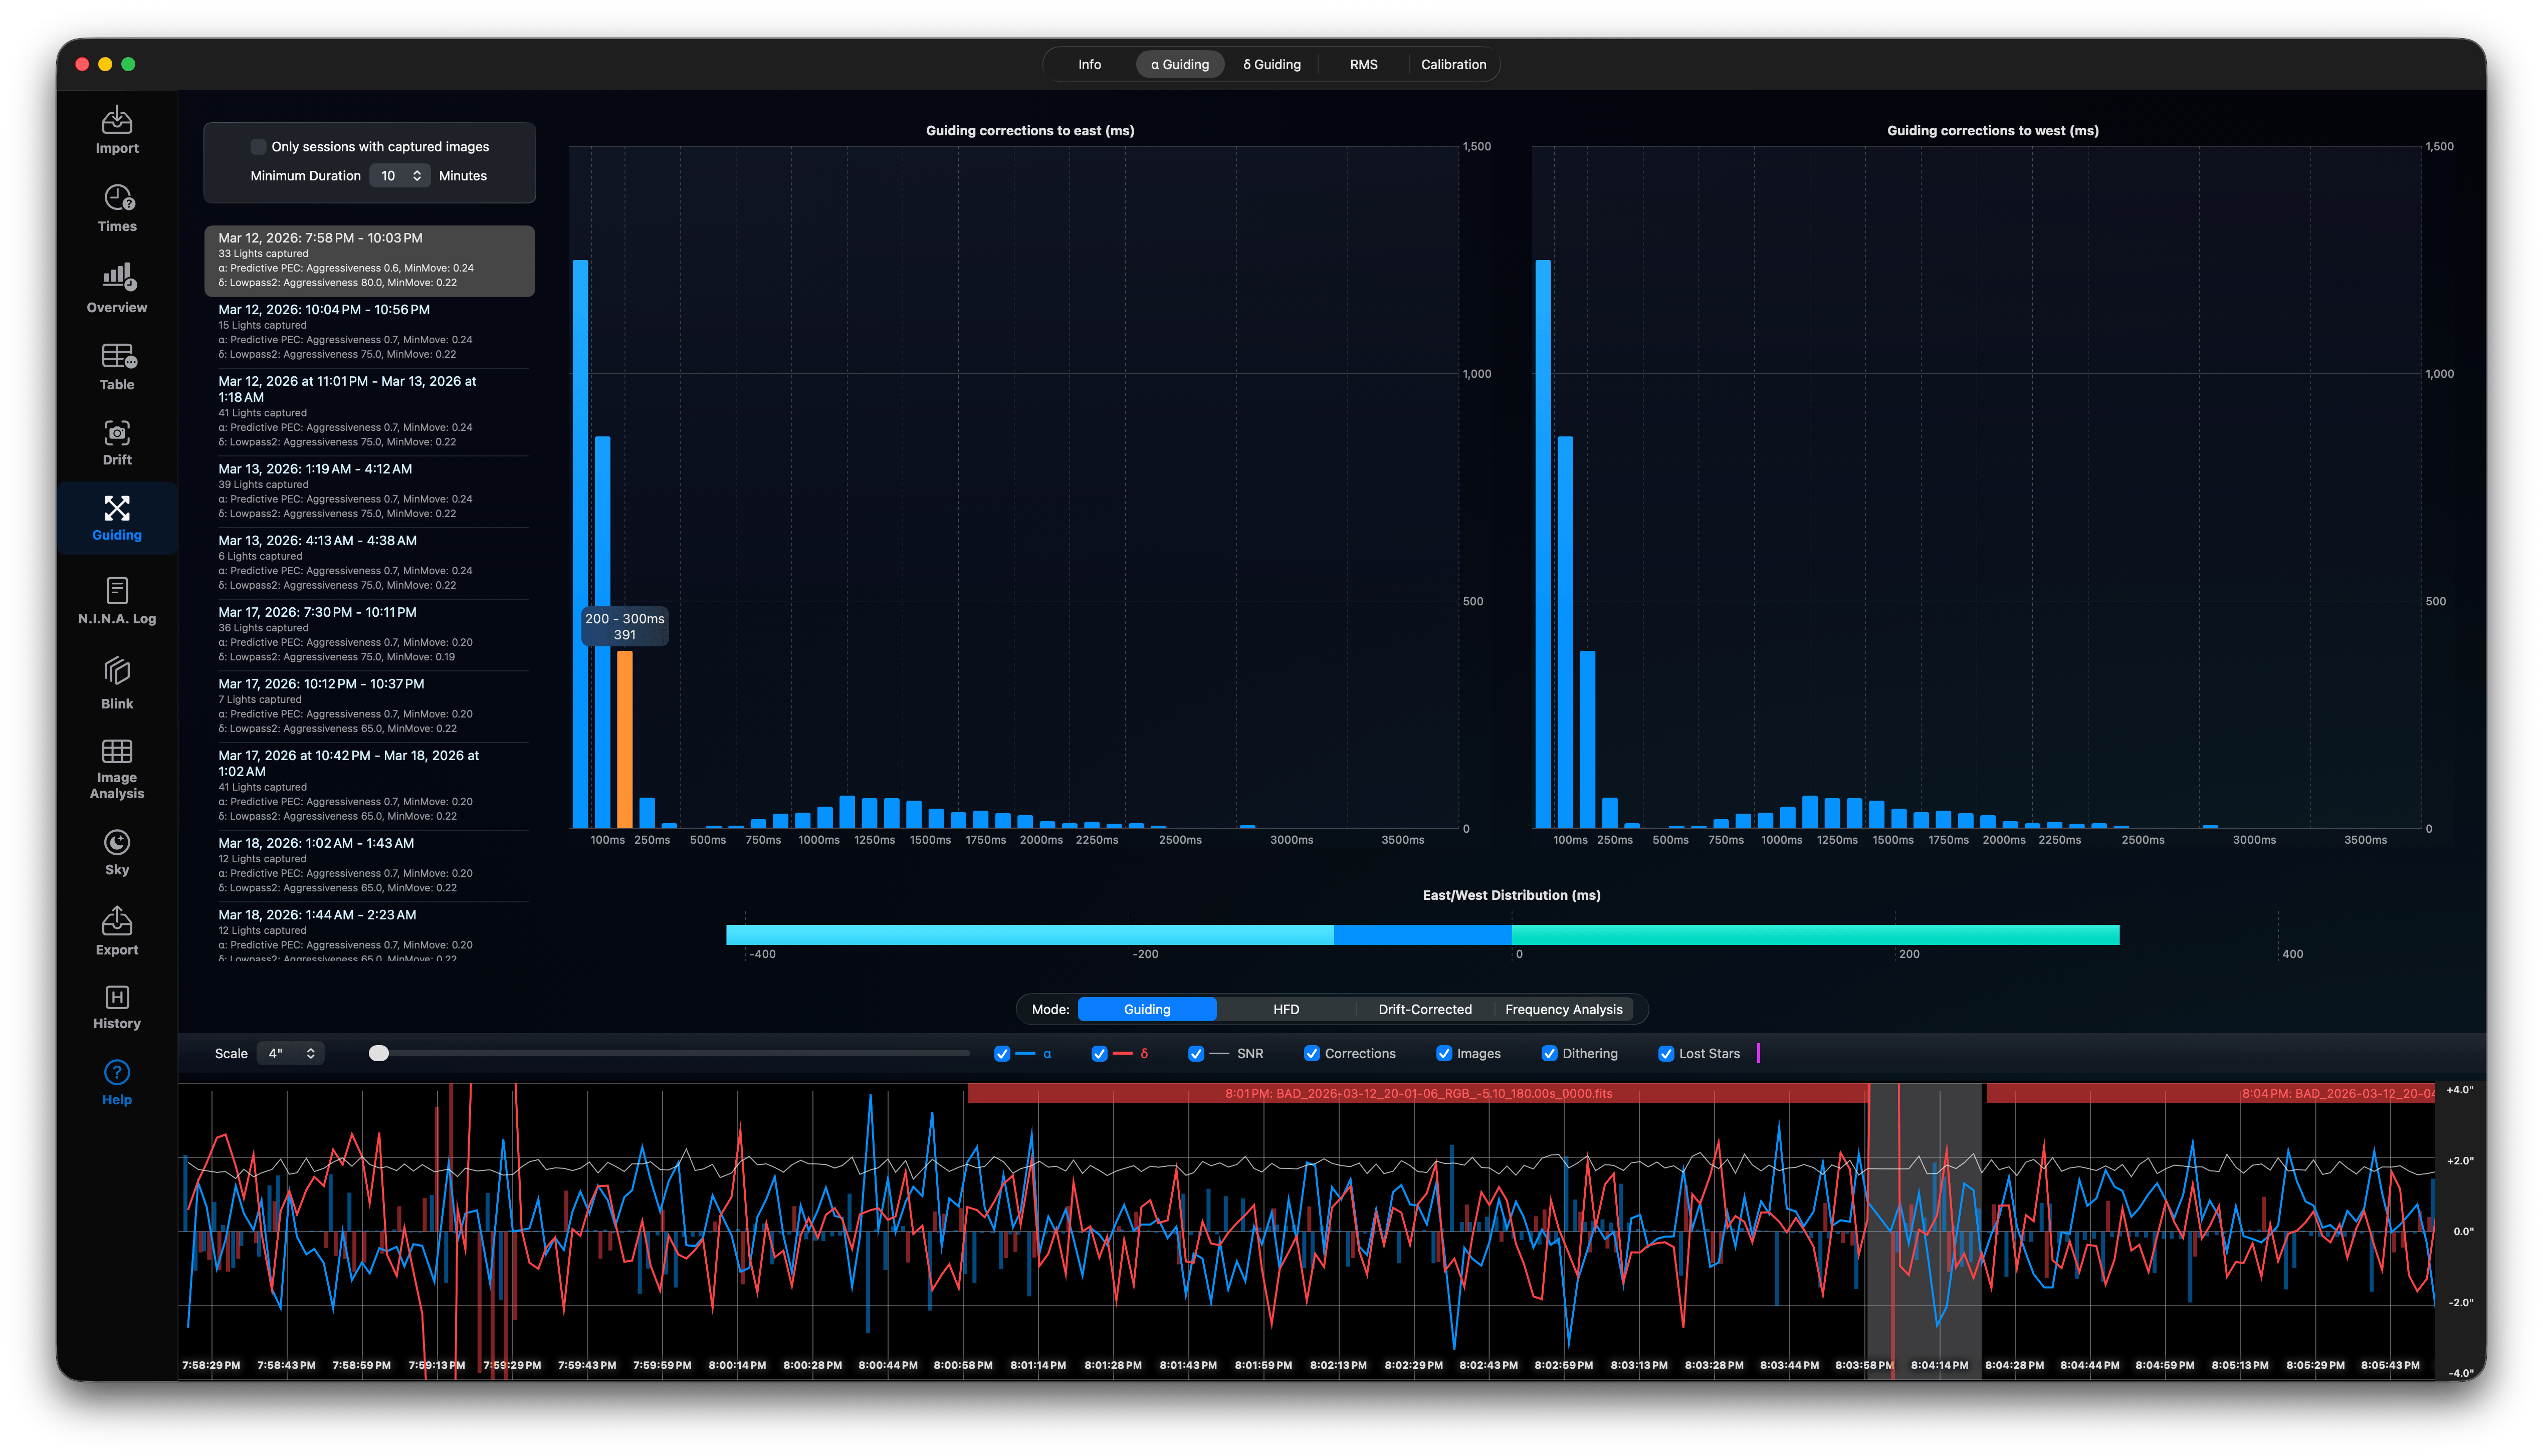
α Guiding
In the right ascension Guiding tab you see the guiding pulse durations to east and west in two charts while capturing lights. Below is a summary chart with all pulses in both directions (keep in mind, the right ascension axis is not moving backwards to east, it just stops for short amount of time). The darker blue range shows there are slightly more corrections to the east than to the west. In almost all cases there will be just a small imbalance between these two directions, but the important thing here is the amount! In this case there is only a small difference of a few milliseconds, which is normal. If you have not balanced your mount properly enough or the Polar Alignment is far from being perfect, this amount will increase. In such cases you should check your mount balance and Polar Alignment.
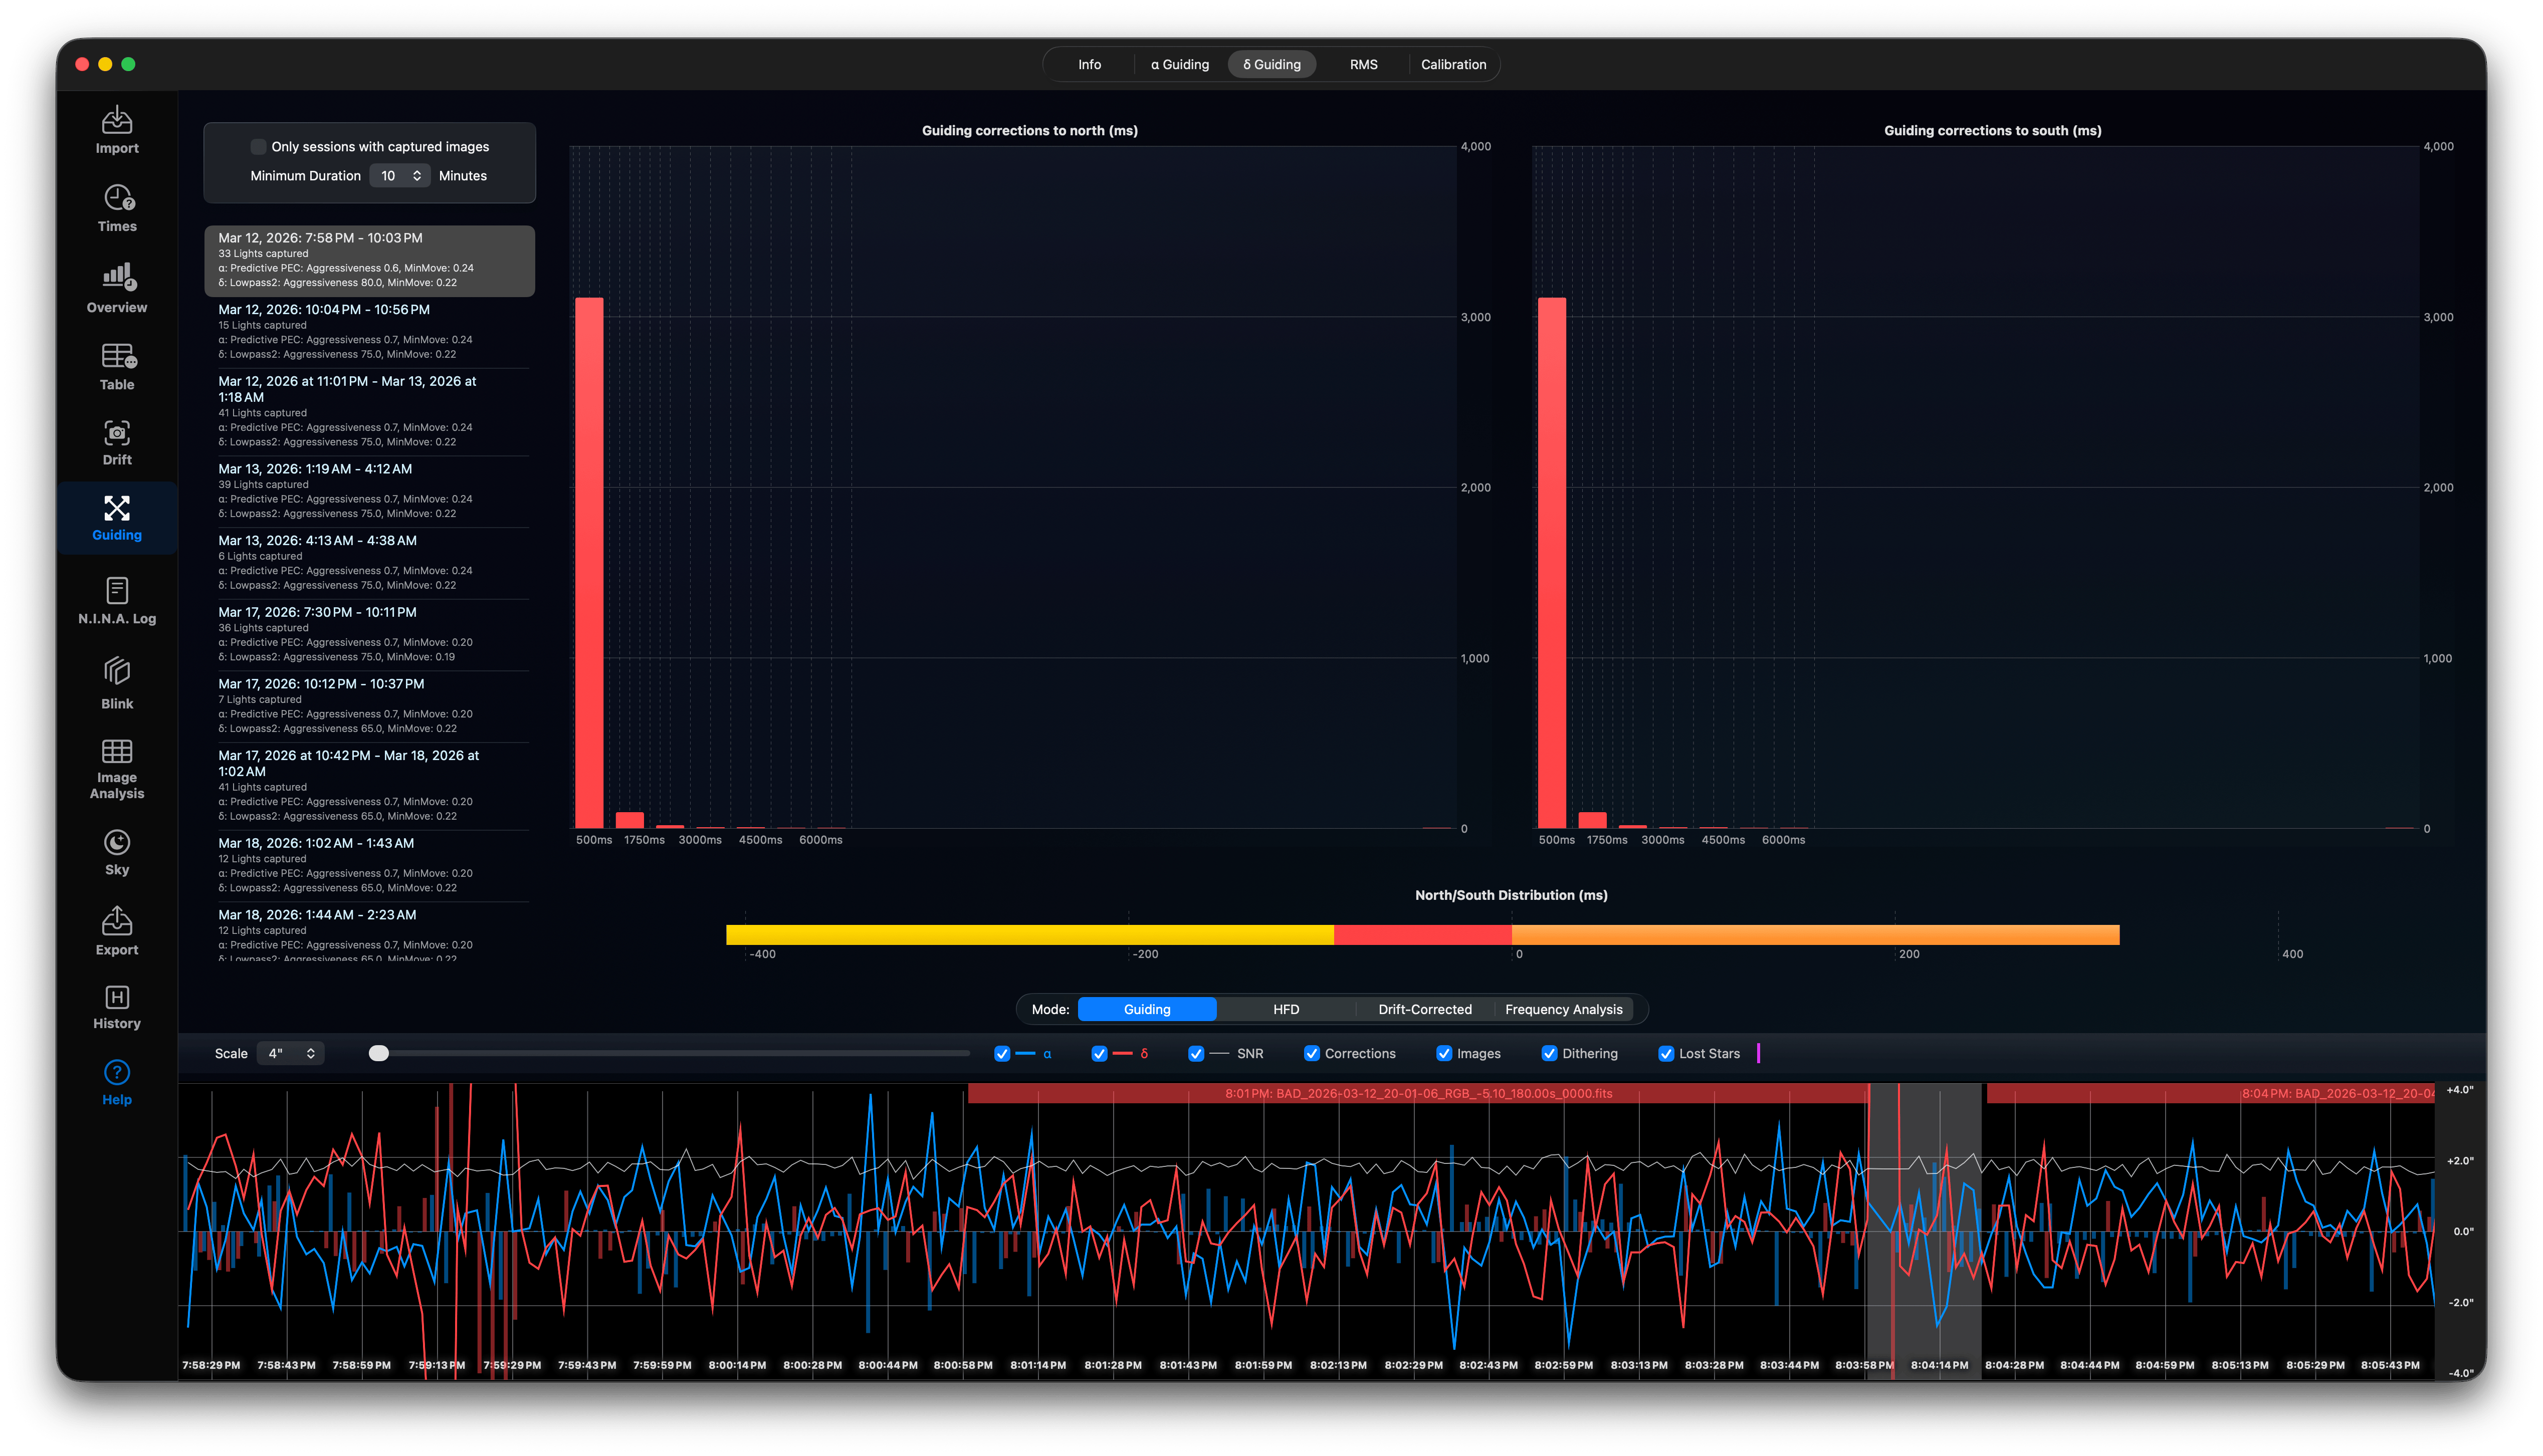
δ Guiding
In the declination Guiding tab you see the guiding pulse durations to north and south in two charts while capturing lights. Below is a summary chart with all pulses in both directions. The darker red range shows there are slightly more corrections to the north than to the south. In almost all cases there will be just a small imbalance between these two directions, but the important thing here is the amount! In this case there is only a small difference of a few milliseconds, which is normal. If you have not balanced your mount properly enough or the Polar Alignment is far from being perfect, this amount will increase. In such cases you should check your mount balance and Polar Alignment.
RMS
For the selected guiding session you see the Oscillations and Overcorrections. On the top left the Pie Chart shows the RMS error and the amount of overcorrections in right ascension and declination due to aggressiveness settings in PHD2. To much overcorrection means you should decrease the aggressiveness, because PHD2 sends to long correction pulses overshooting this axis, which triggers another correction pulse.
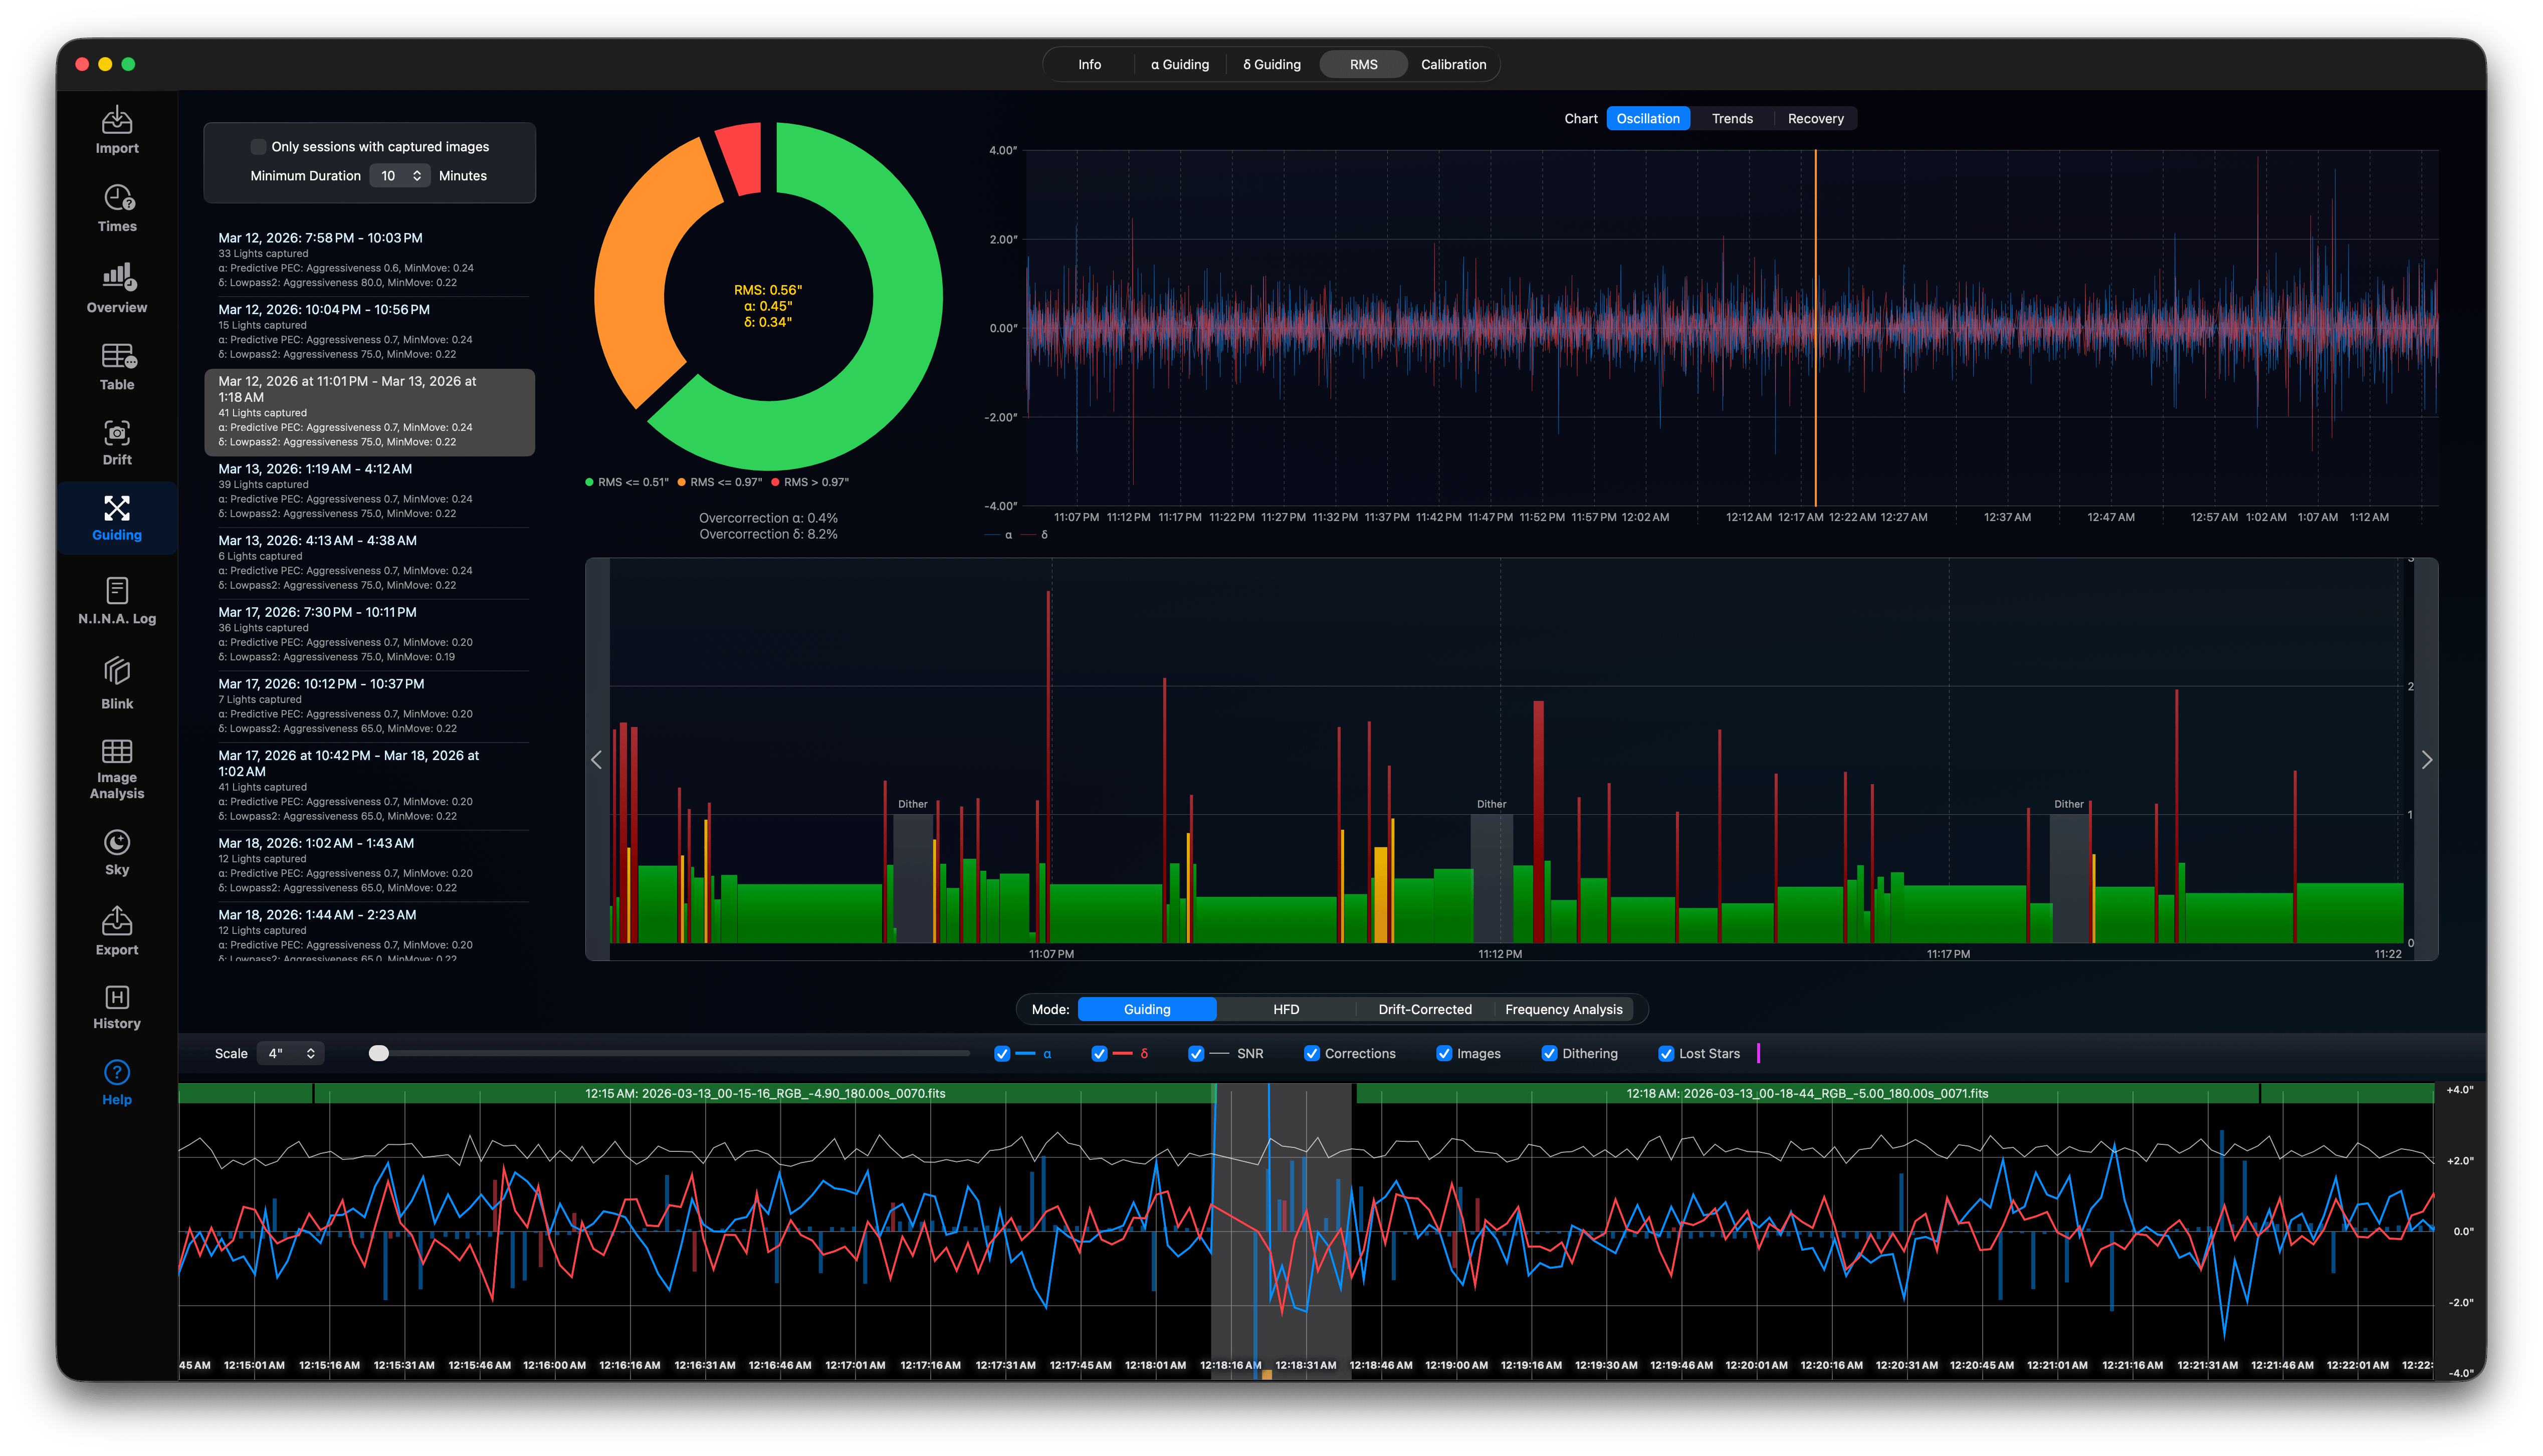
The oscillation chart shows a condensed chart of all guiding oscillators for both axis. Move the mouse over an oscillation to scroll the guiding chart below to this position. The chart in the middle shows all guide pulses in three categories. The green pulses are of low aggressiveness, the yellow pulses have medium aggressiveness and the red pulses are pulses with higher duration and elongation.
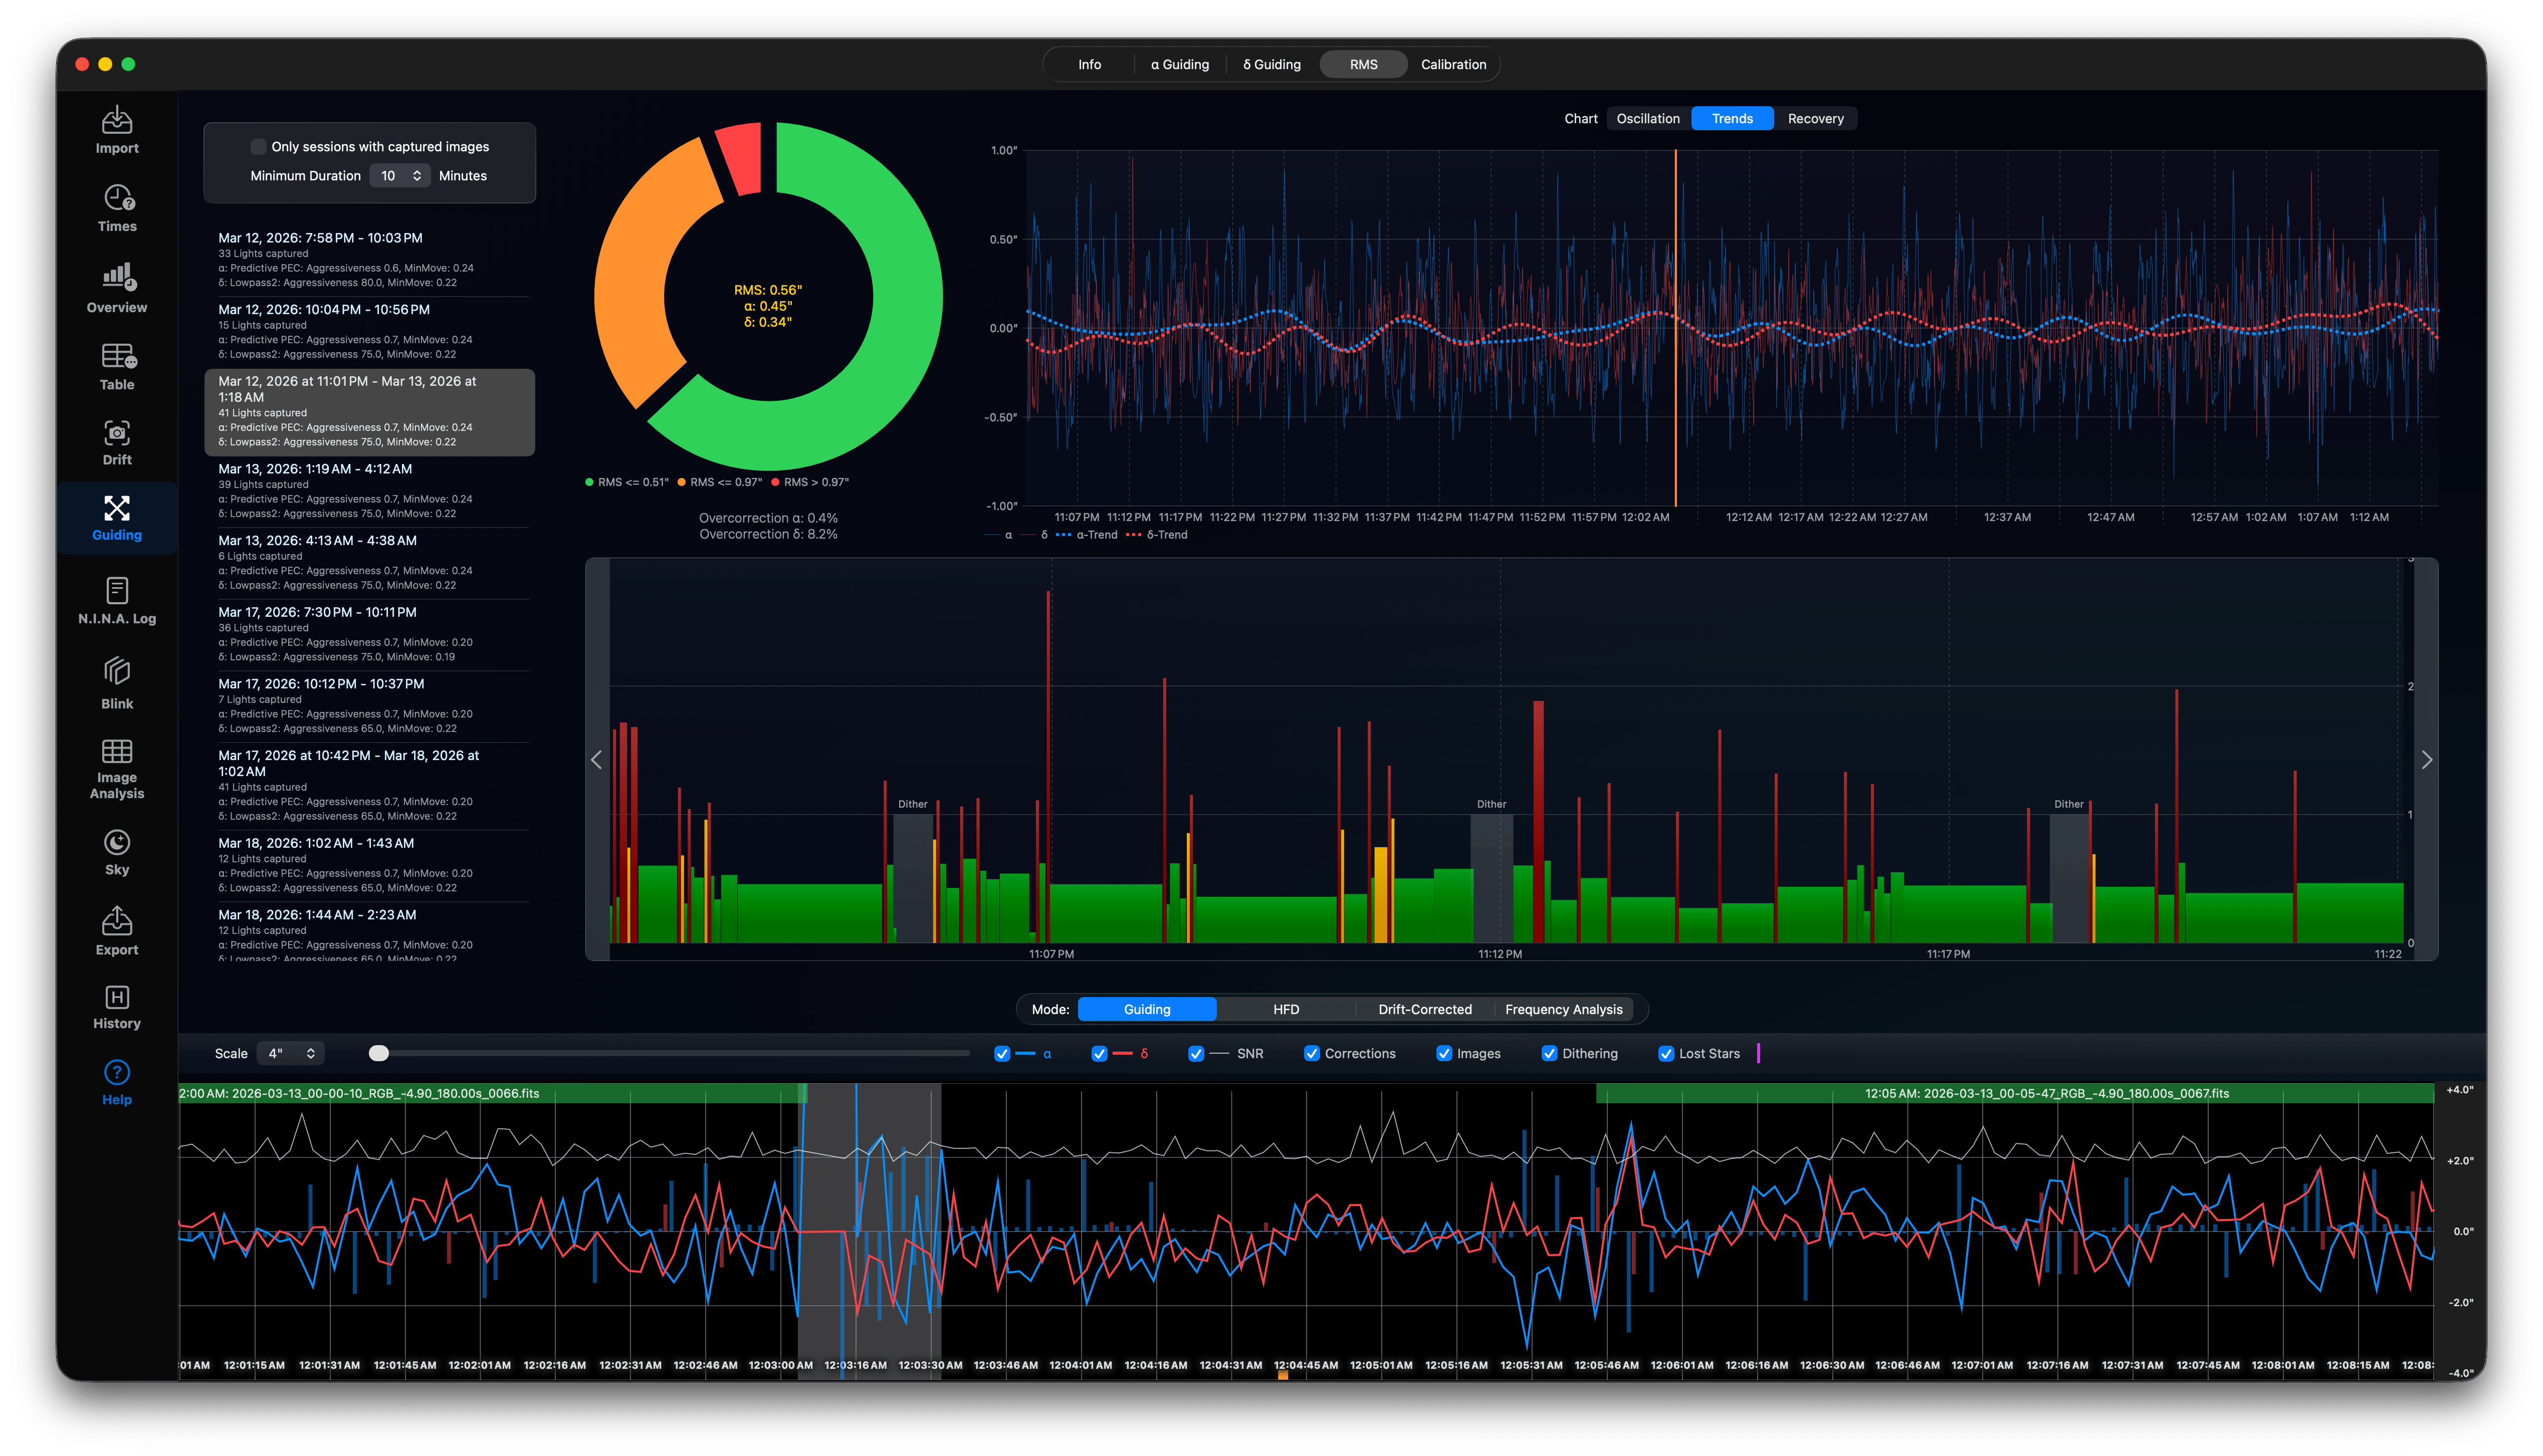
You can also use the trend lines and recovery. The trends shows the drift trends and the Recovery shows the time it took to recover from overshot guide pulses. It is not entirely avoidable, that PHD2 sometimes overshoots due to atmospheric conditions, however if this happens to often you should check your guiding settings and reduce aggressiveness.
You can switch the guiding chart between four display modes:
- Guiding: Displays guiding deviations (arcseconds) in RA and Dec along with correction pulses.
- Drift Corrected: Displays tracking deviations with mount drift filtered out, highlighting high-frequency mechanical errors.
- Frequencies: Uses Fast Fourier Transform (FFT) analysis to show periodic tracking errors, helping identify gear backlash or wind gusts.
- HFD: Tracks the HFD of the guide star, indicating guide star focus drift or thin clouds. PHD2_DebugLog is required!
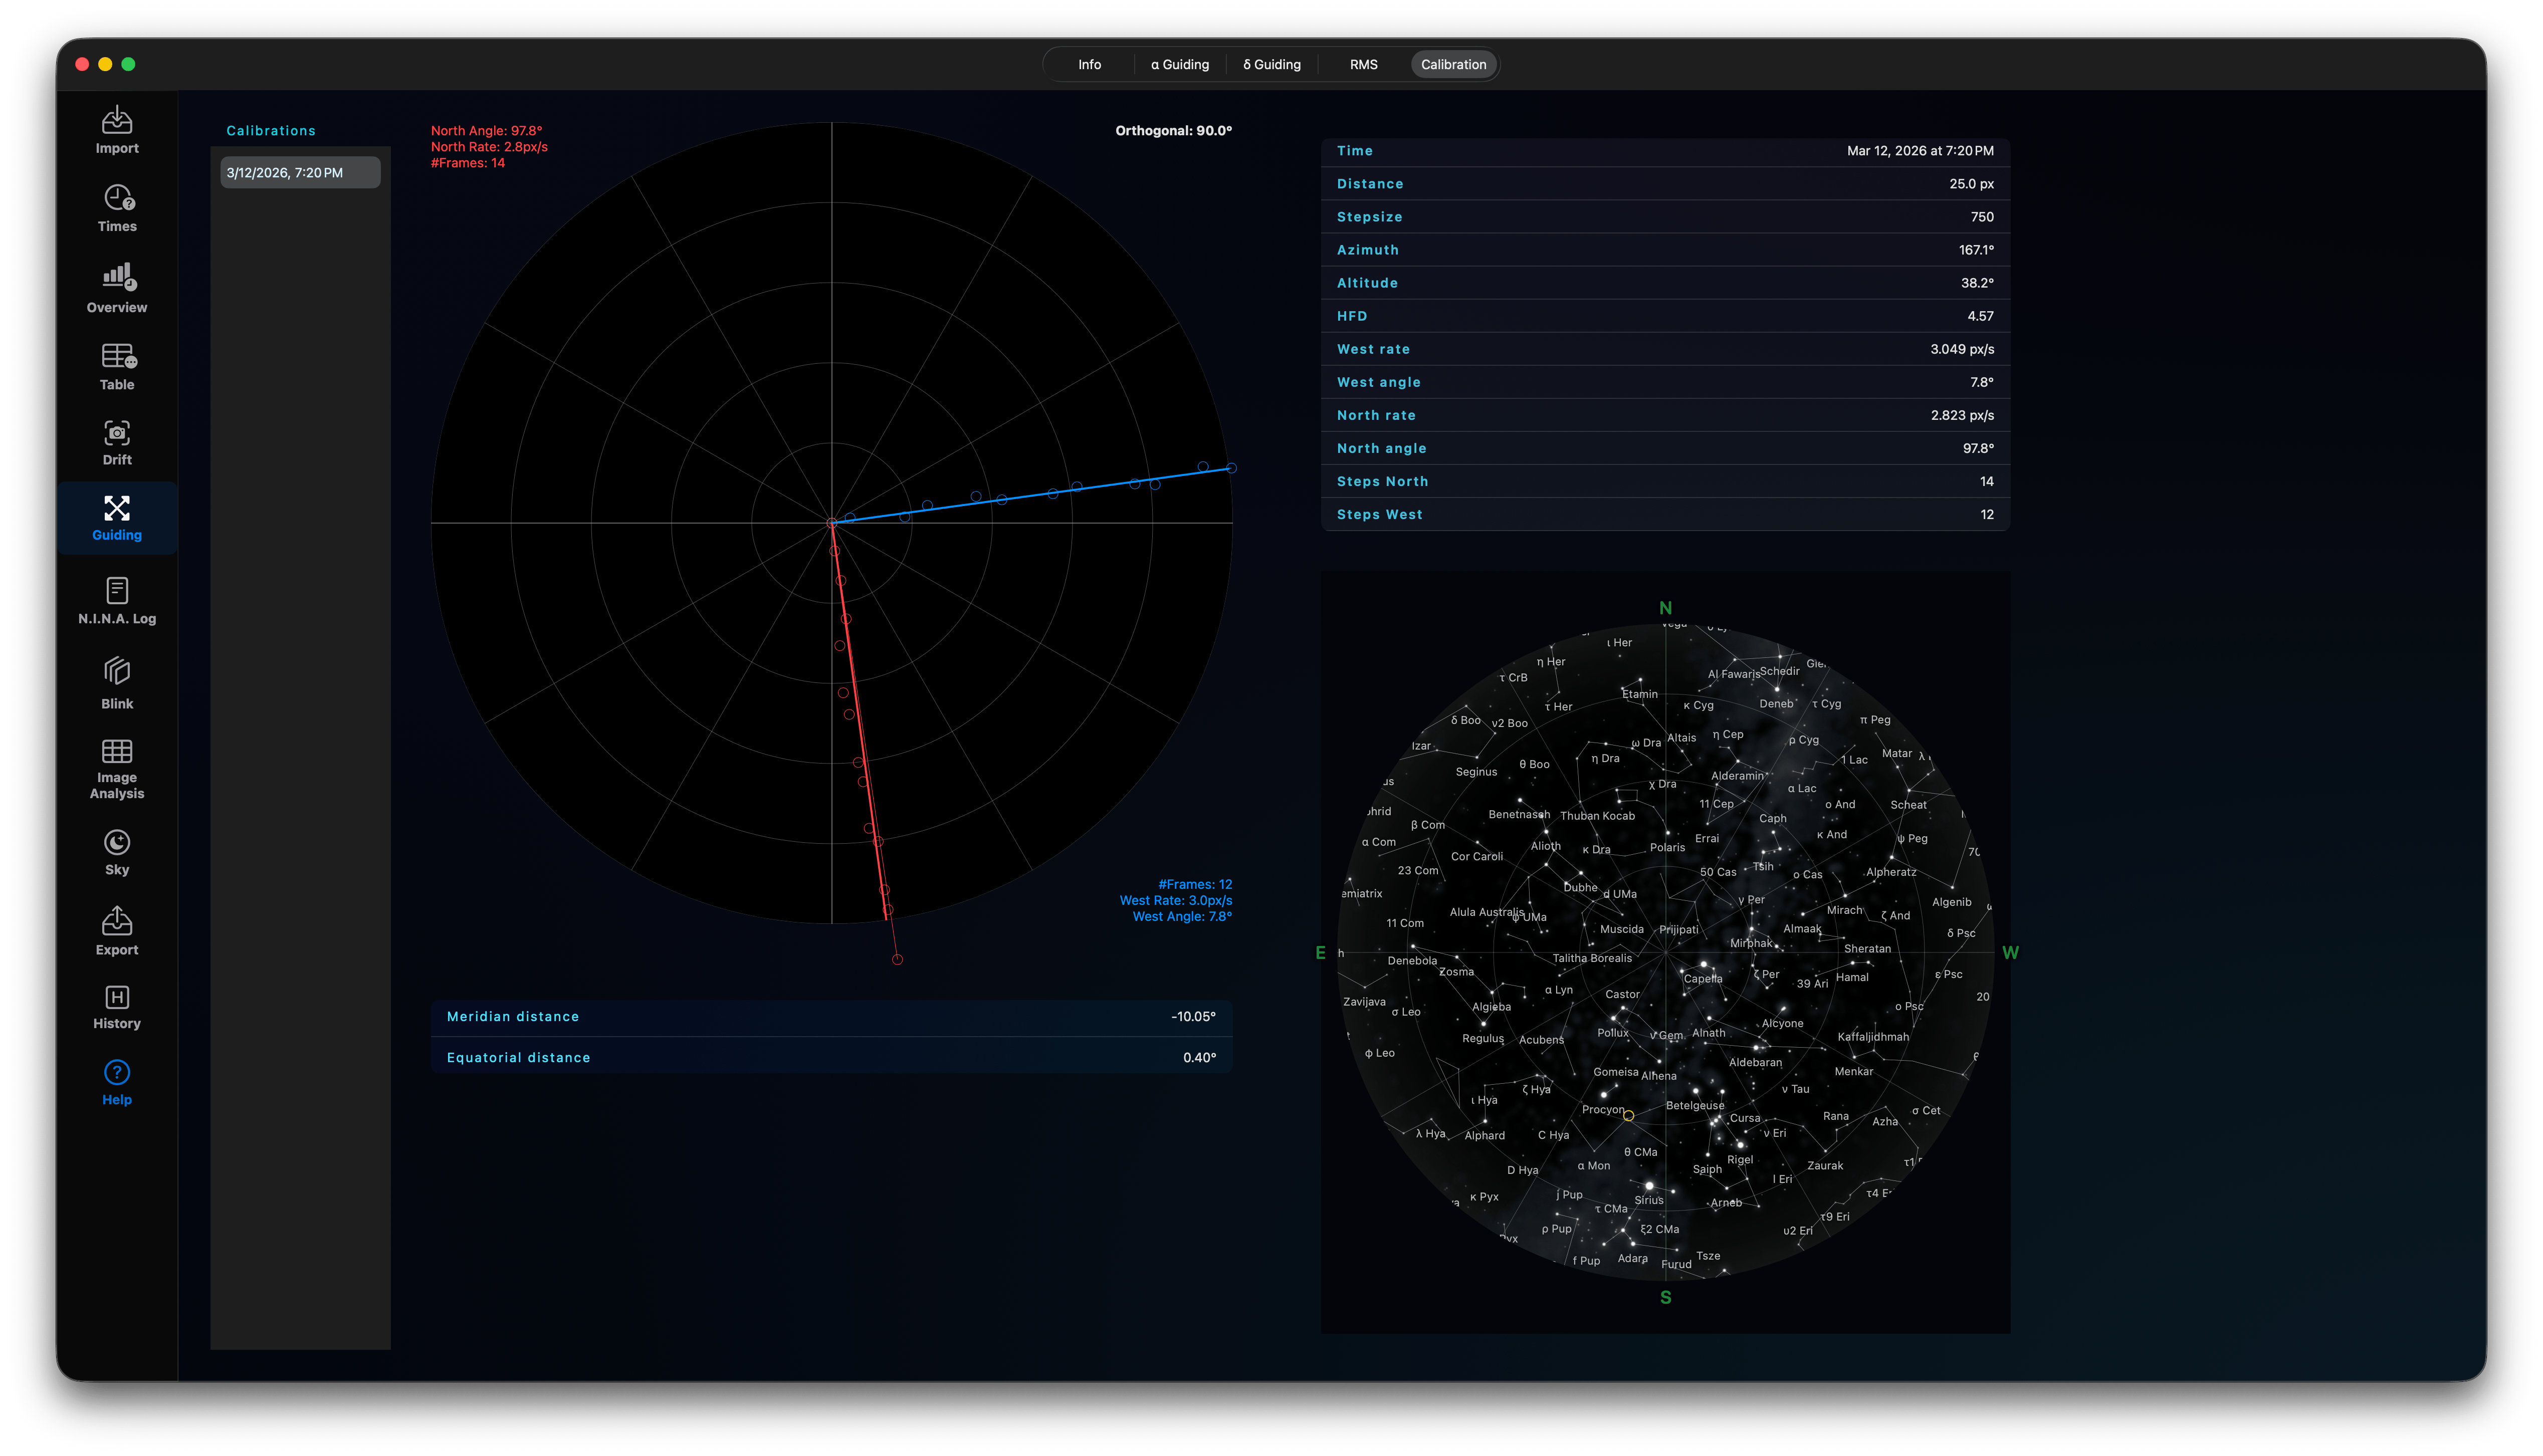
Calibration Analytics
The sidebar lists all calibration runs. Selecting a calibration plots its RA/Dec orthogonal paths and calculations. You can see where in the sky the calibration took place. Check if the calibration positions are orthogonal.