Image Analysis (Optical Inspector)
The Image Analysis view (ImageAnalysisView) checks optical alignment, focus distribution, and sensor issues. You can use the analysis with the lights from your session, but keep in mind that long exposures might affect the results of your analysis. You can also import special short exposure lights just to analyse your optics.
Sub-Analysis Tabs
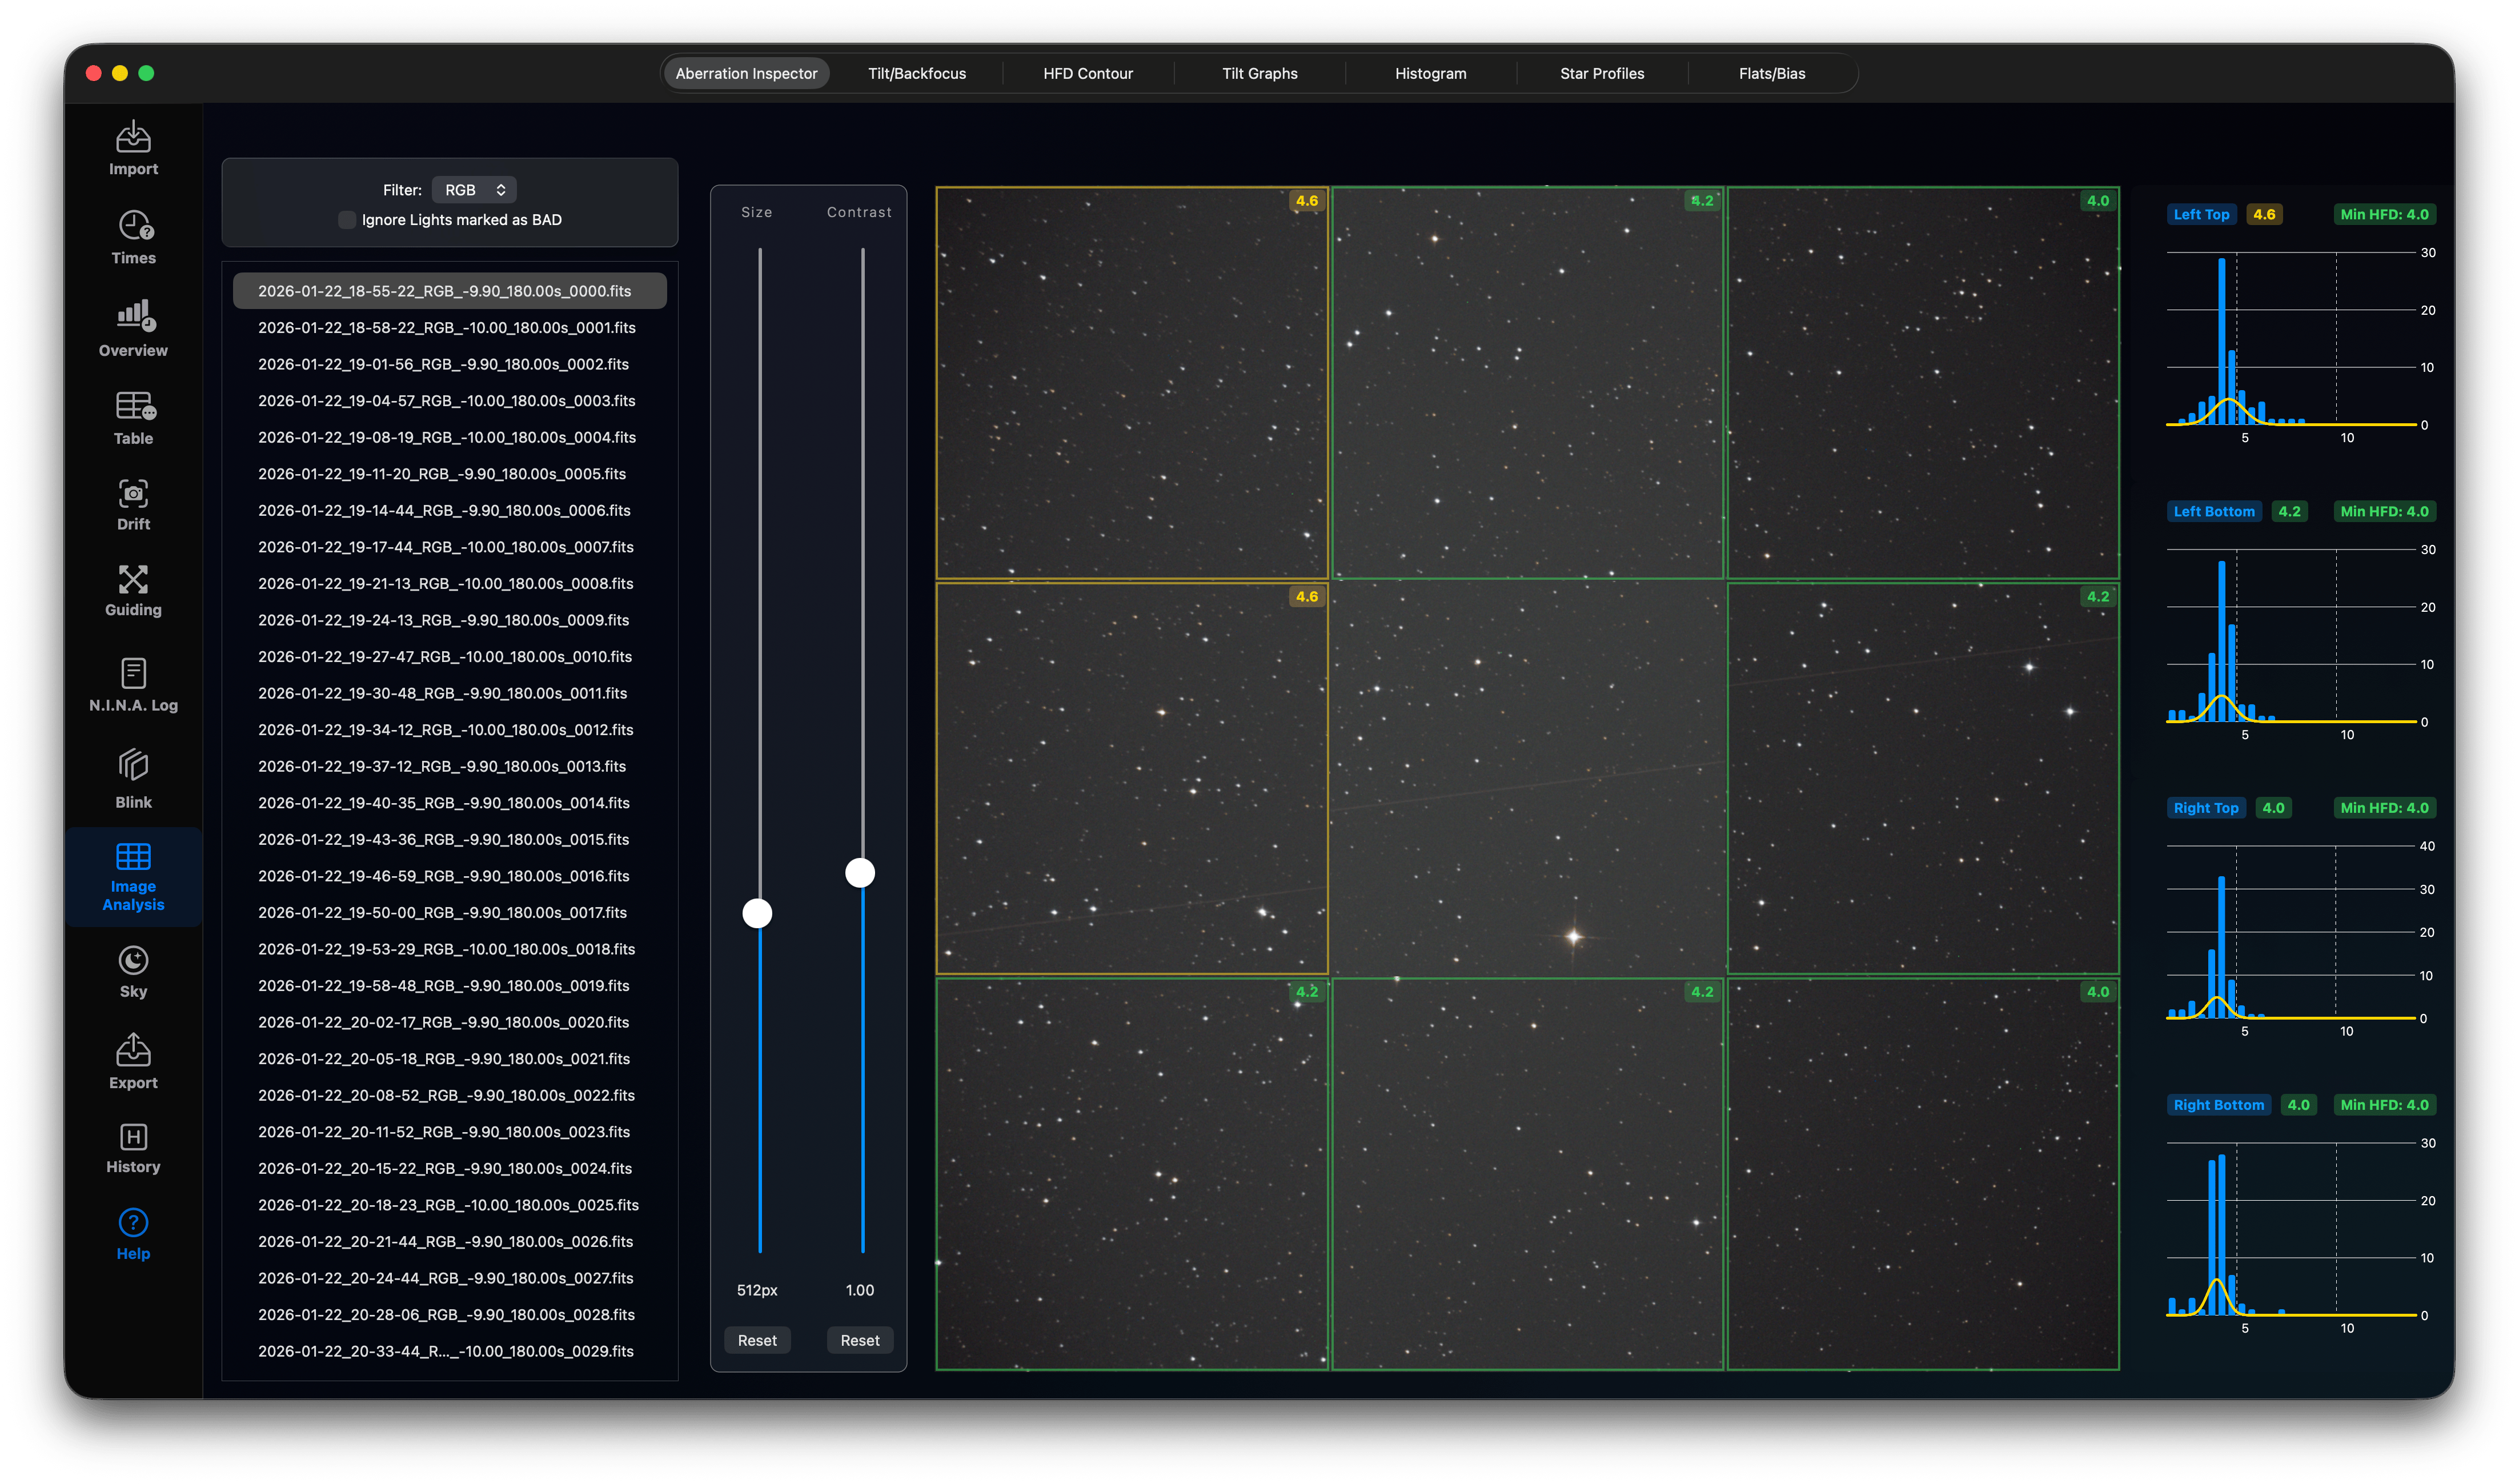
1. Aberration Inspector
Divides the image into a 3x3 grid to compare the center and corners, helping identify field curvature, tilt, or backfocus issues. You can adjust the grid size and contrast. On the right-handed side you find the HFD charts for each grid based on the stars inside each grid. Please check if all panels have nearly identical HFD values. Panels with slightly higher HFD values have a yellow border and panels with more than 15% higher HFD values have a red border indicating some kind of back focus or tilt issue.
2. Tilt/Backfocus Advisor
Estimates sensor tilt and back focus distance based on HFR calculations of stars across the frame:
- Displays tilt percentage and direction.
- Recommends adjustments to spacer thickness.
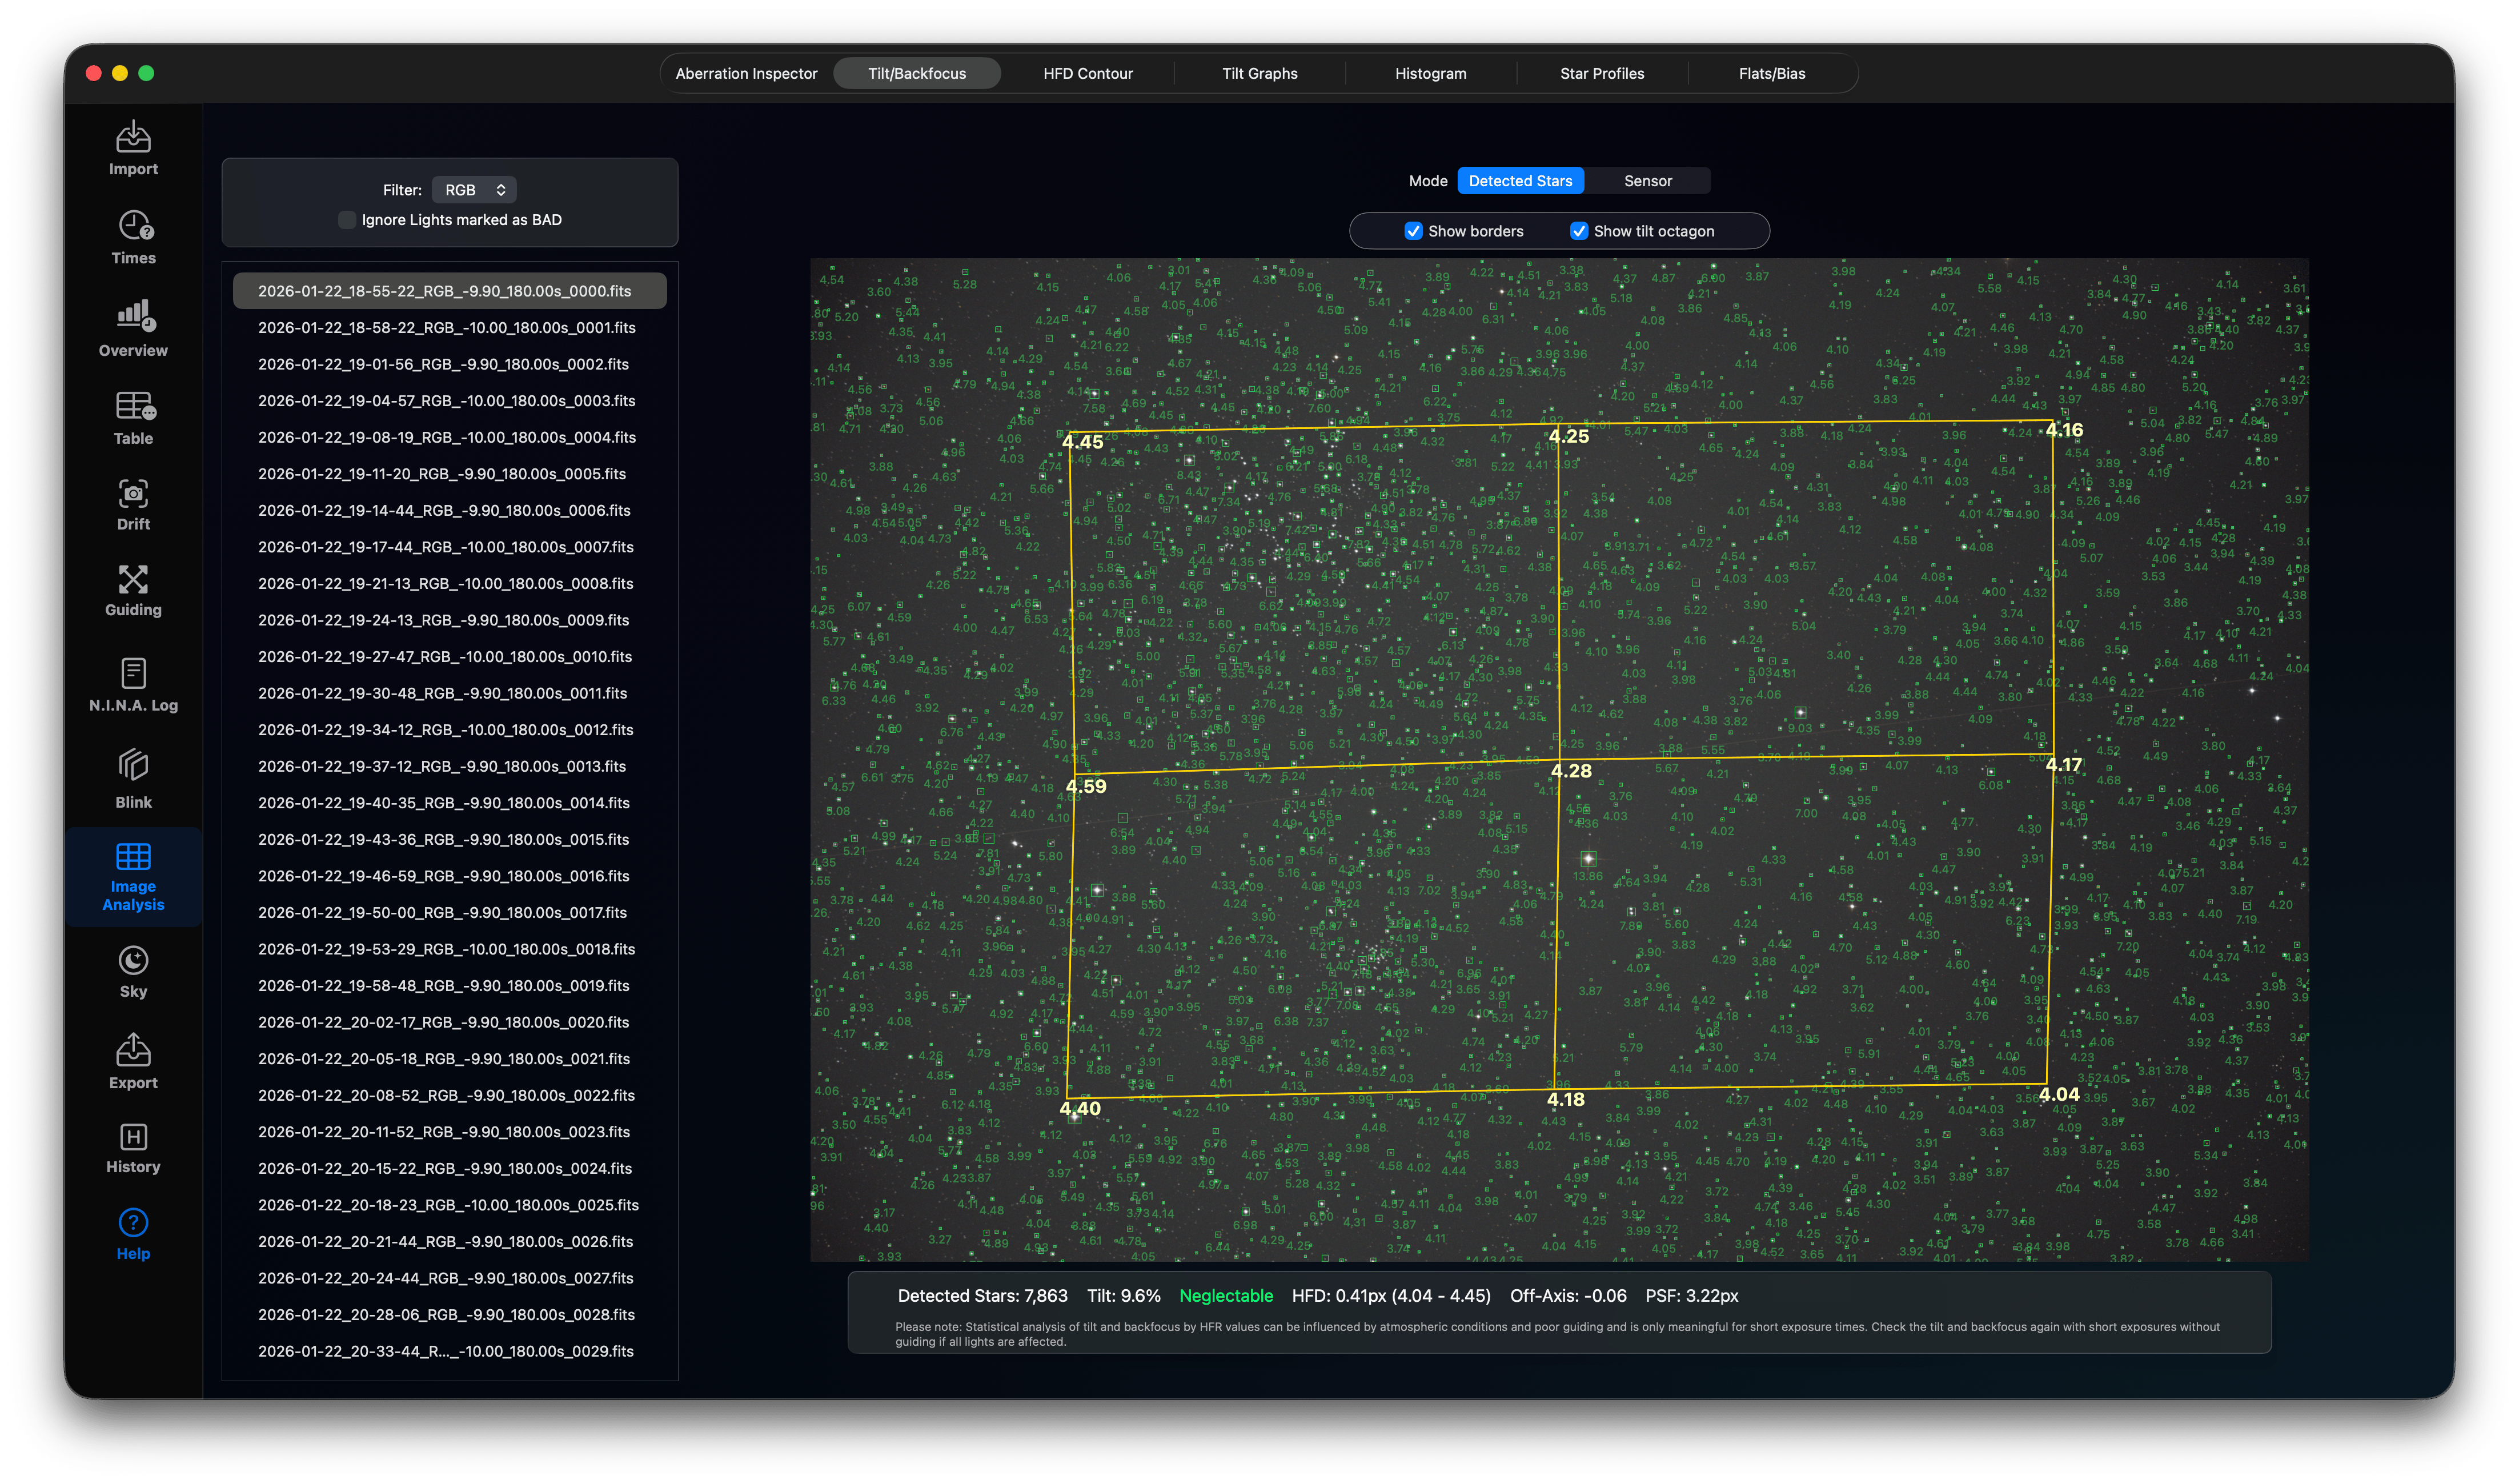
This view shows the detected stars with their HFD values and a tilt octagon. Under best circumstances all corners would have identical HFD values, but especially when analysing long exposure lights, the atmospheric conditions might introduce small distortions. However, if you a get a hint for large tit, which is not neglect-able, or a larger value for Off-Axis, then you should check your tilt and back focus with short exposure lights and you will probably need to correct your optics/back focus, especially if you see this in all your lights, not just a few.
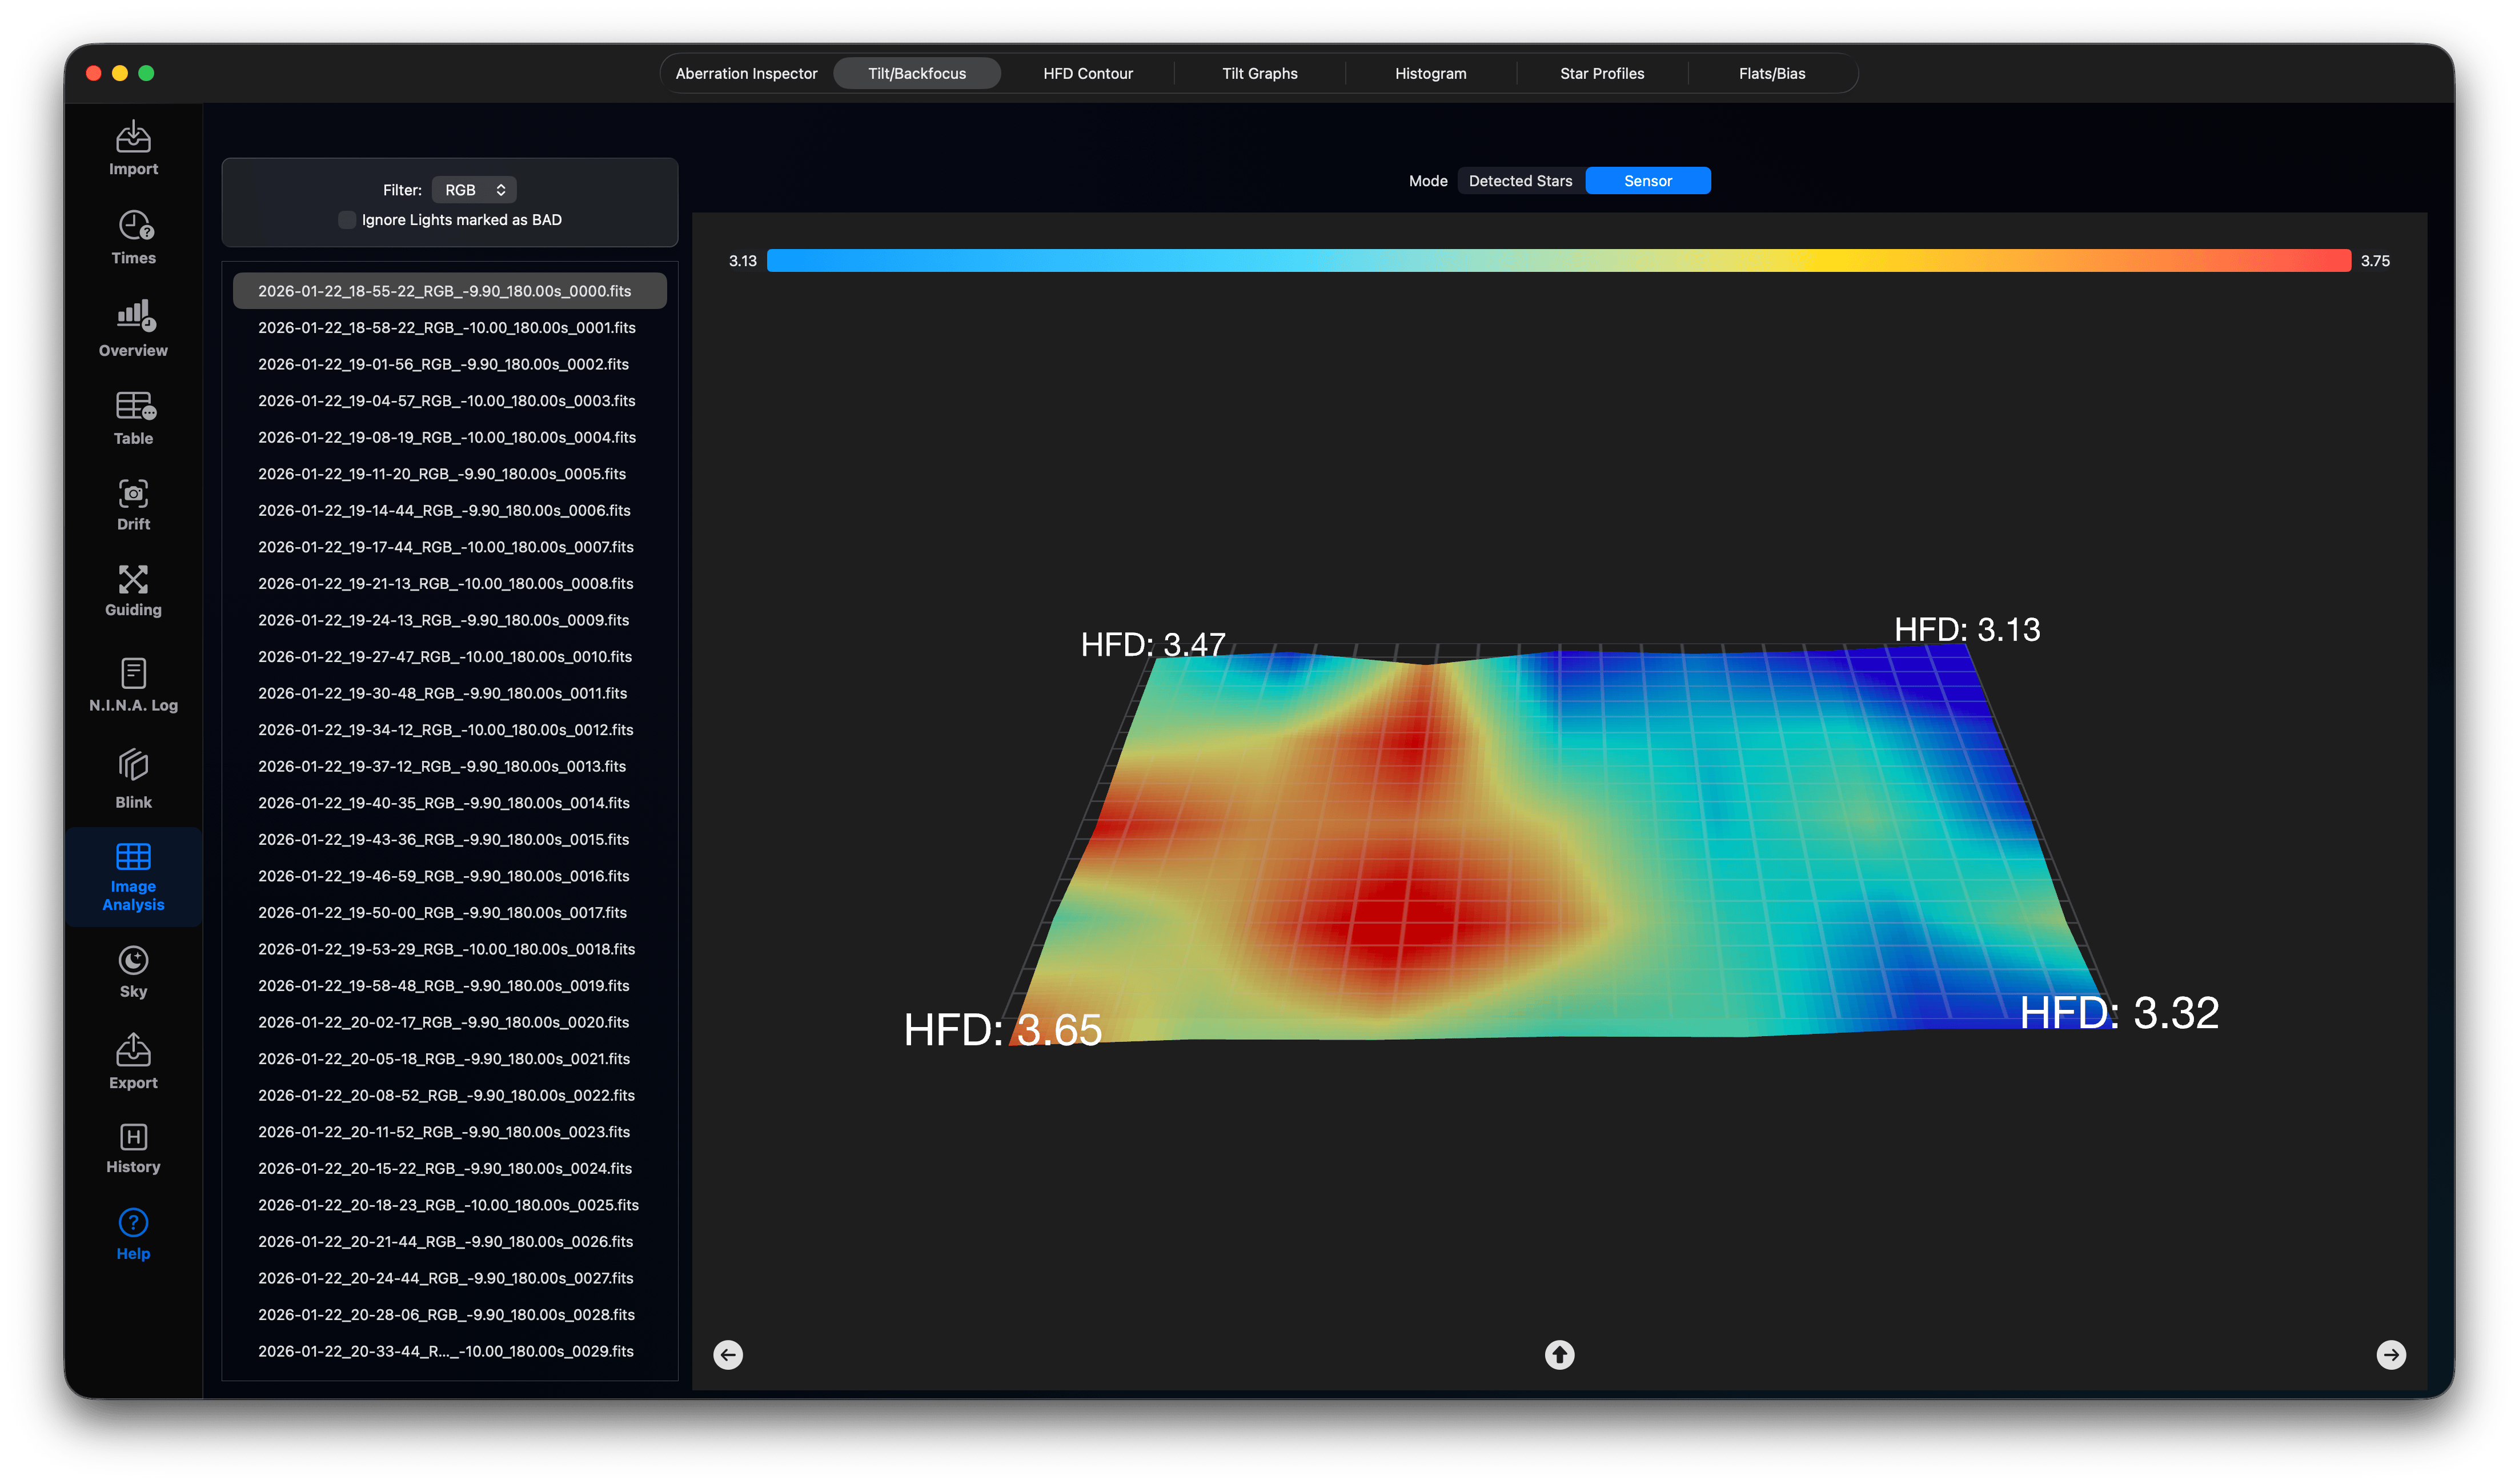
You can also have a look at the sensor level. In a perfect world, the mesh surface would be perfectly even along the sensor plane. However, these are measured HFD values under real world atmospheric conditions and they are never plain. A real tilt would be shown when the mesh is higher or lower on one corner or edge of the sensor. Keep in mind: this is very sensitive and a small deviation like the one shown here must not be a tilt issue. In this special case, my f/4 Newton was adjusted well enough creating elongated stars in one corner (which are already visible in the Aberration Inspector).
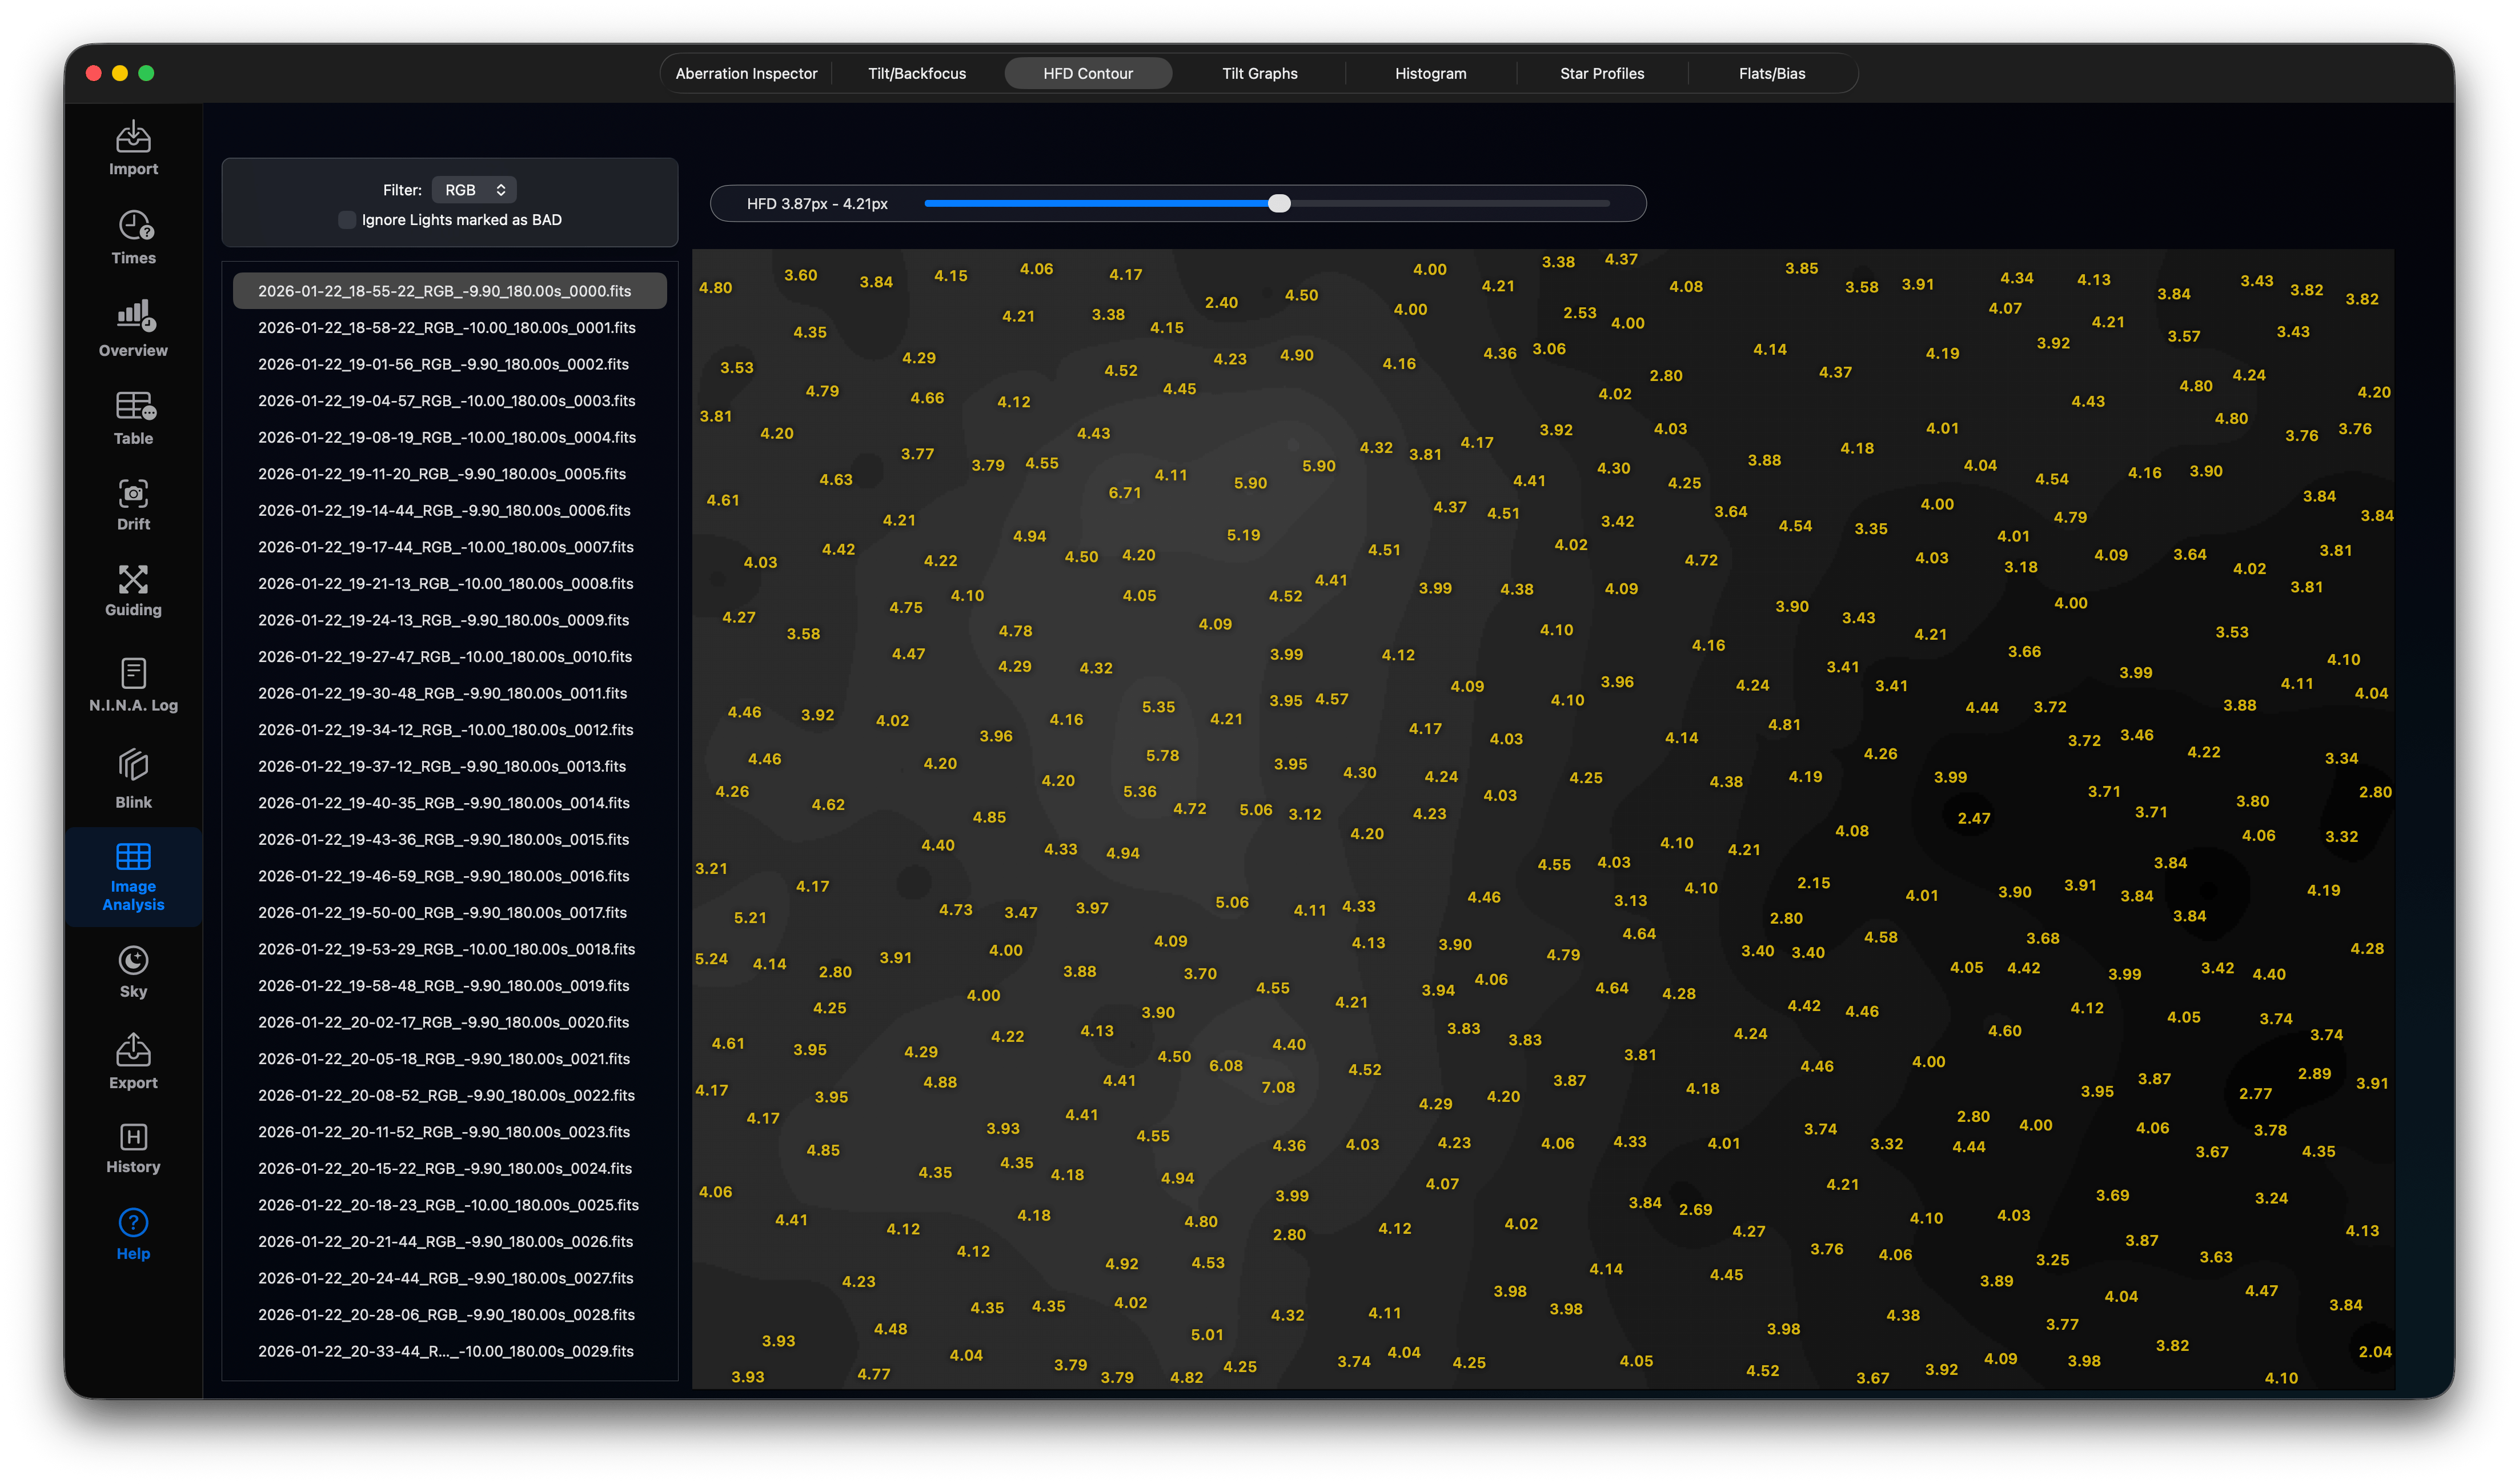
3. HFD Contour Mapping
Draws a 2D topographical contour map of HFR values across the sensor, helping visualise field flatness and optical astigmatism. Use the slider to change the number of shades of gray to get a smoother contour map. Brighter regions have higher HFD values and will contain more bright stars or might indicate back focus or tilt, if placed at the corners. The processed light contains the M38 star cluster and you see a brighter region where the star cluster is located.
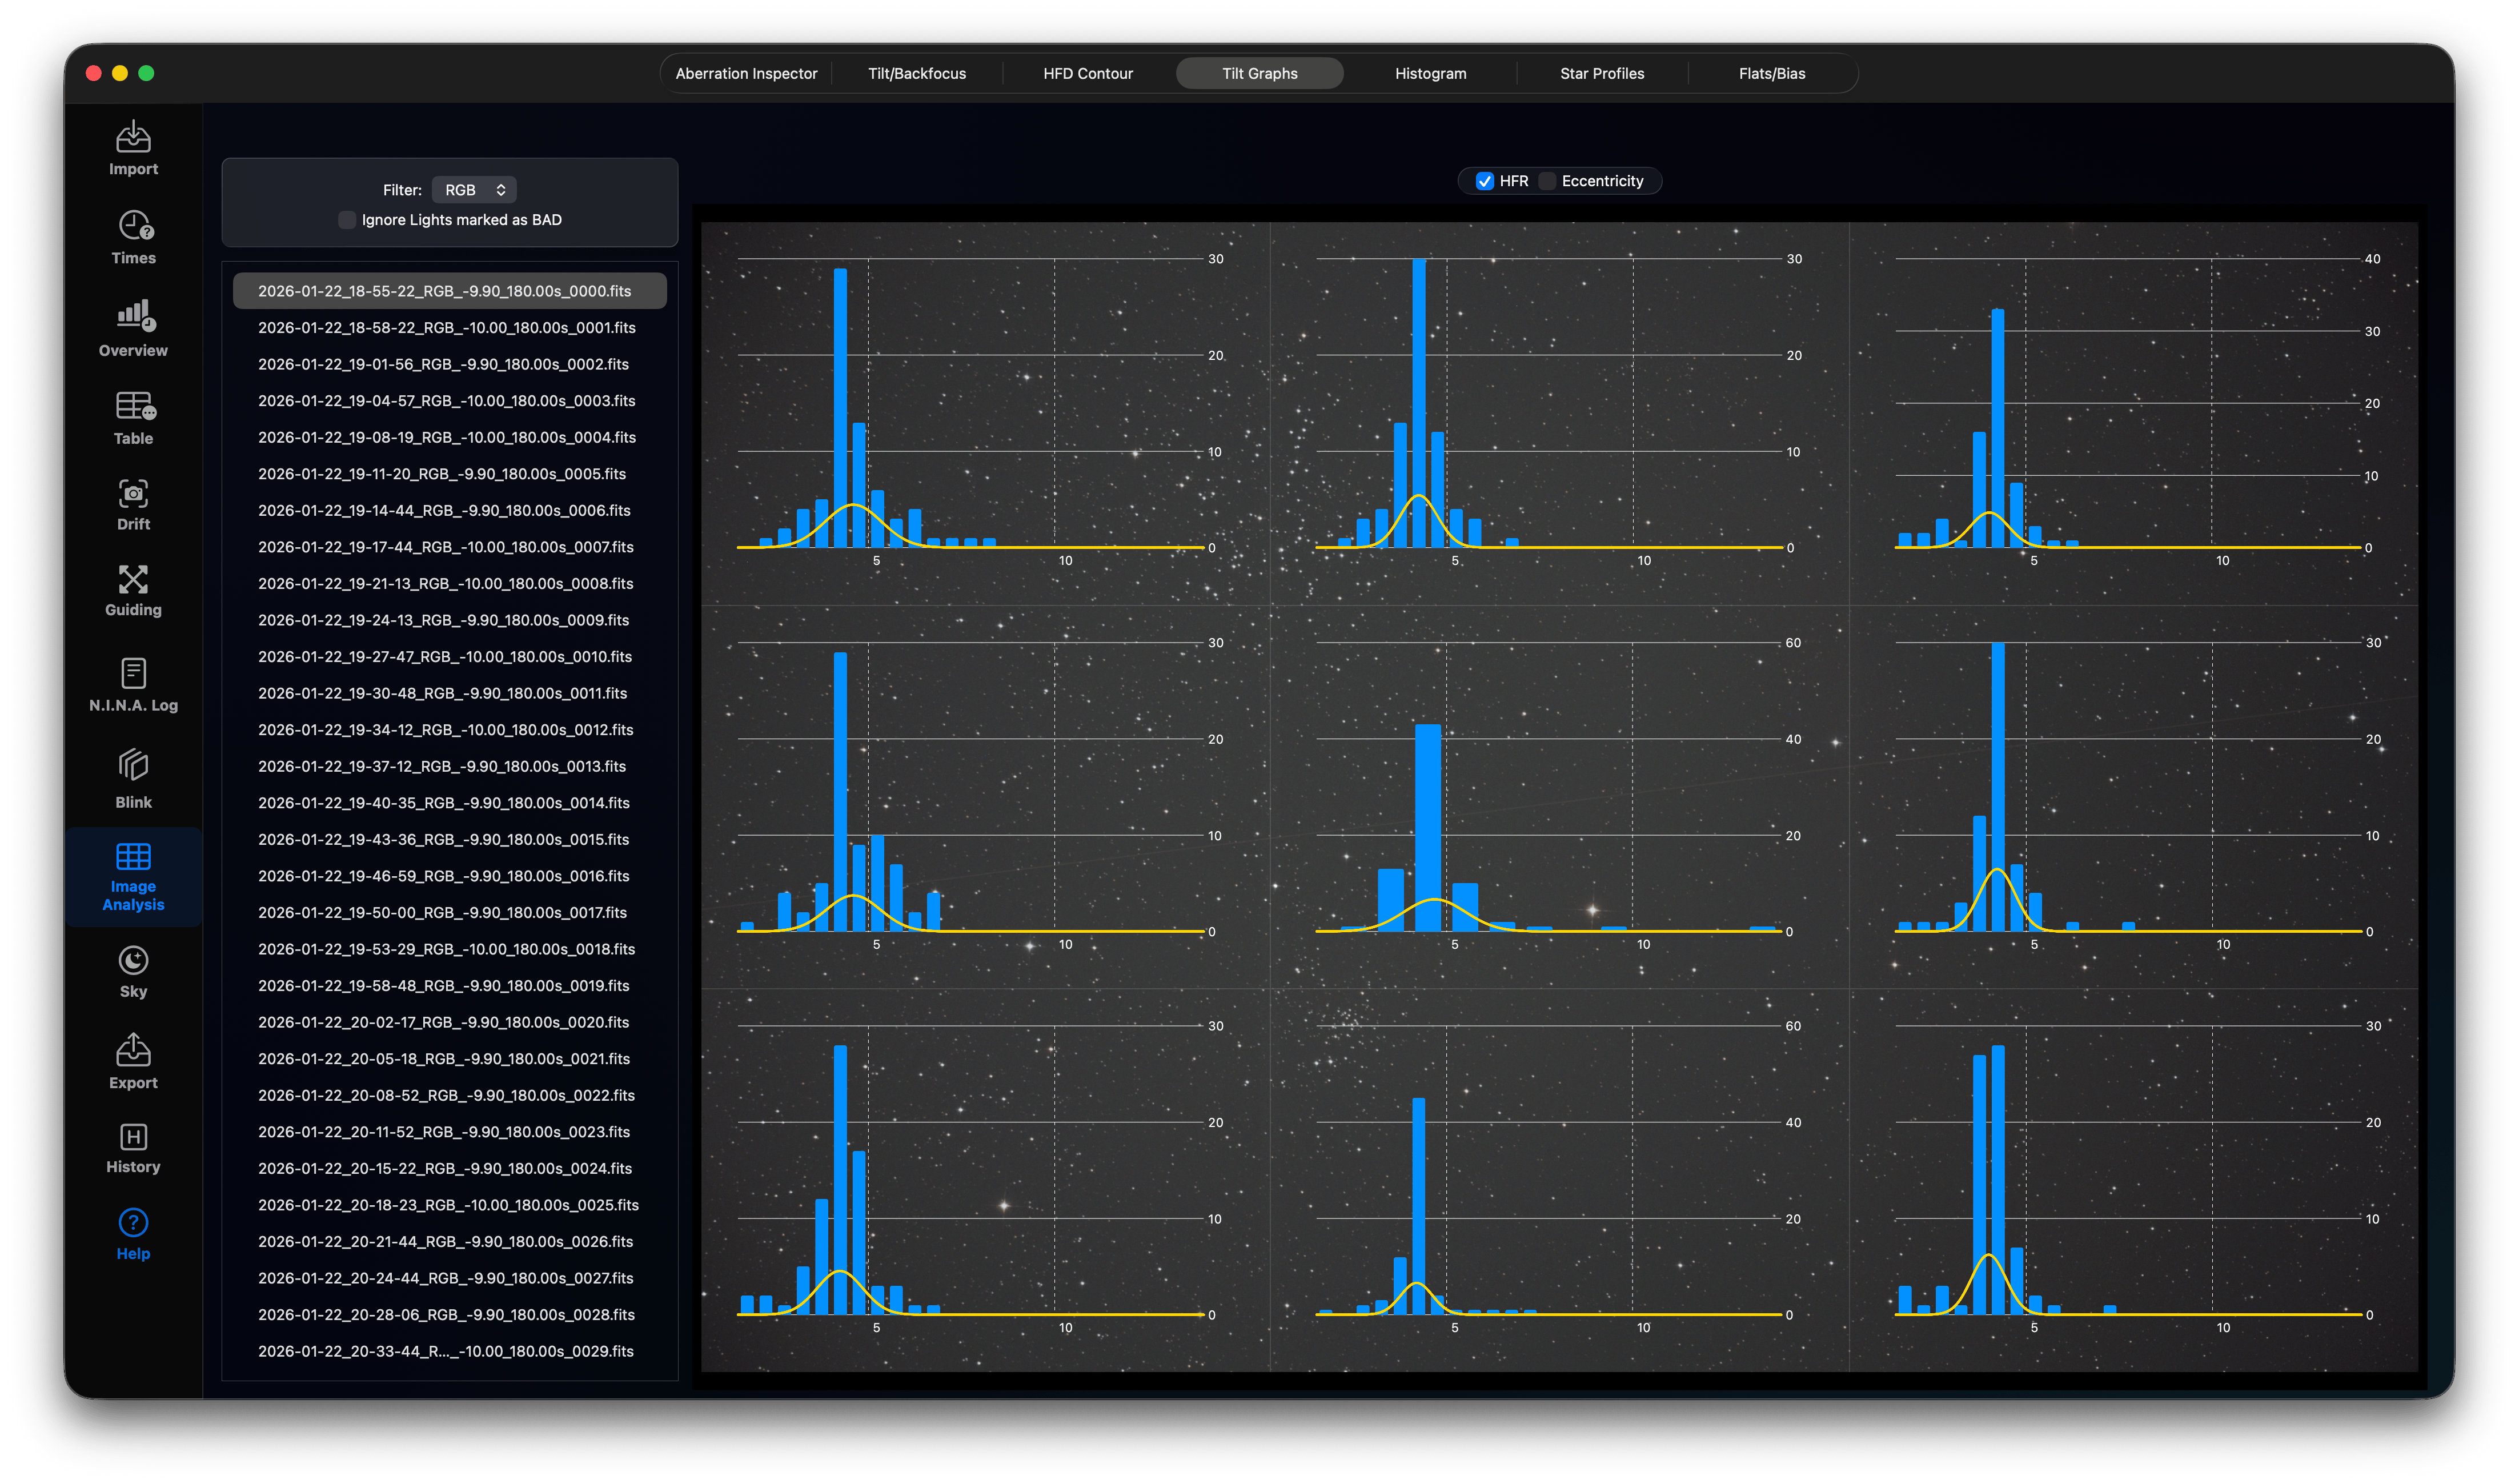
4. Tilt Graphs
This is just another view with charts for each image region. You can switch between HFD values and star eccentricity. The charts show the distribution of HFD values or star eccentricities more detailed and might help to indicate false positives (lights having no tilt due to statistical effects).
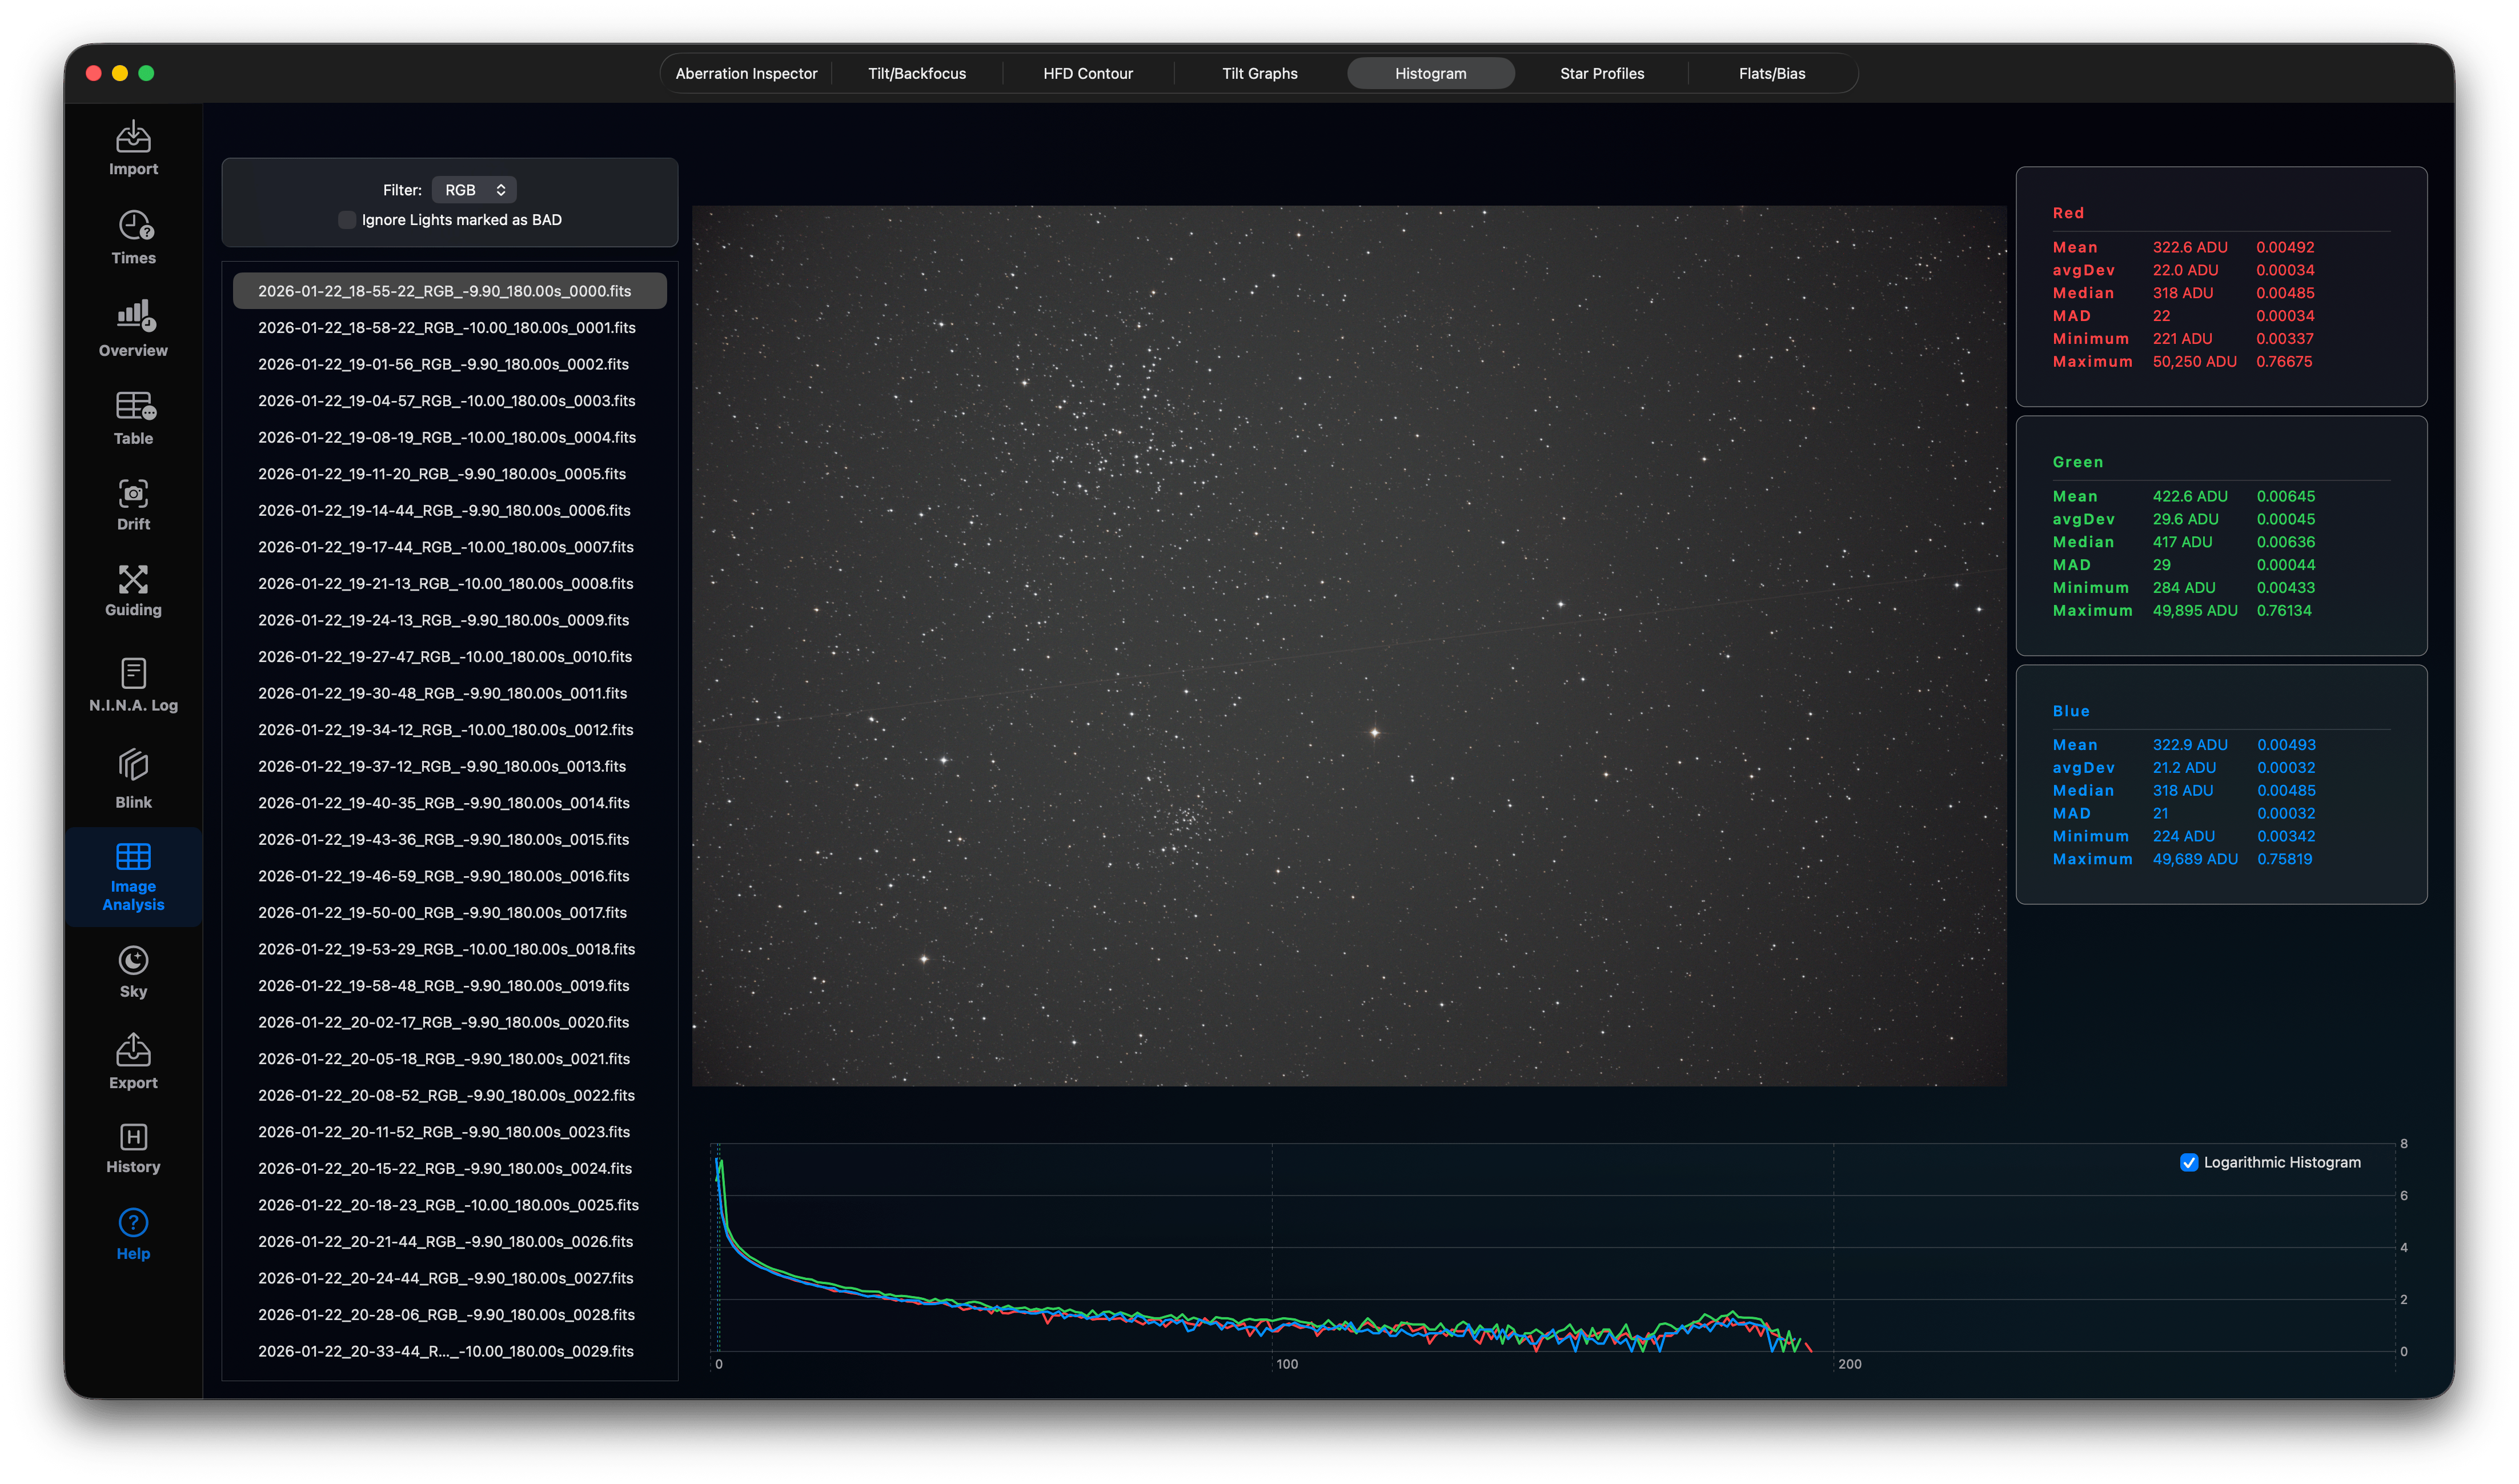
5. Histogram
Plots pixel intensity distributions for individual color channels (RGB) or grayscale to check color balance and light pollution. Use the logarithmic histogram to analyse the stretched image intensity distribution. On the right-hand side you find Mean, average deviation, Median, Median average deviation (MAD), Minimum and Maximum ADU values per channel.
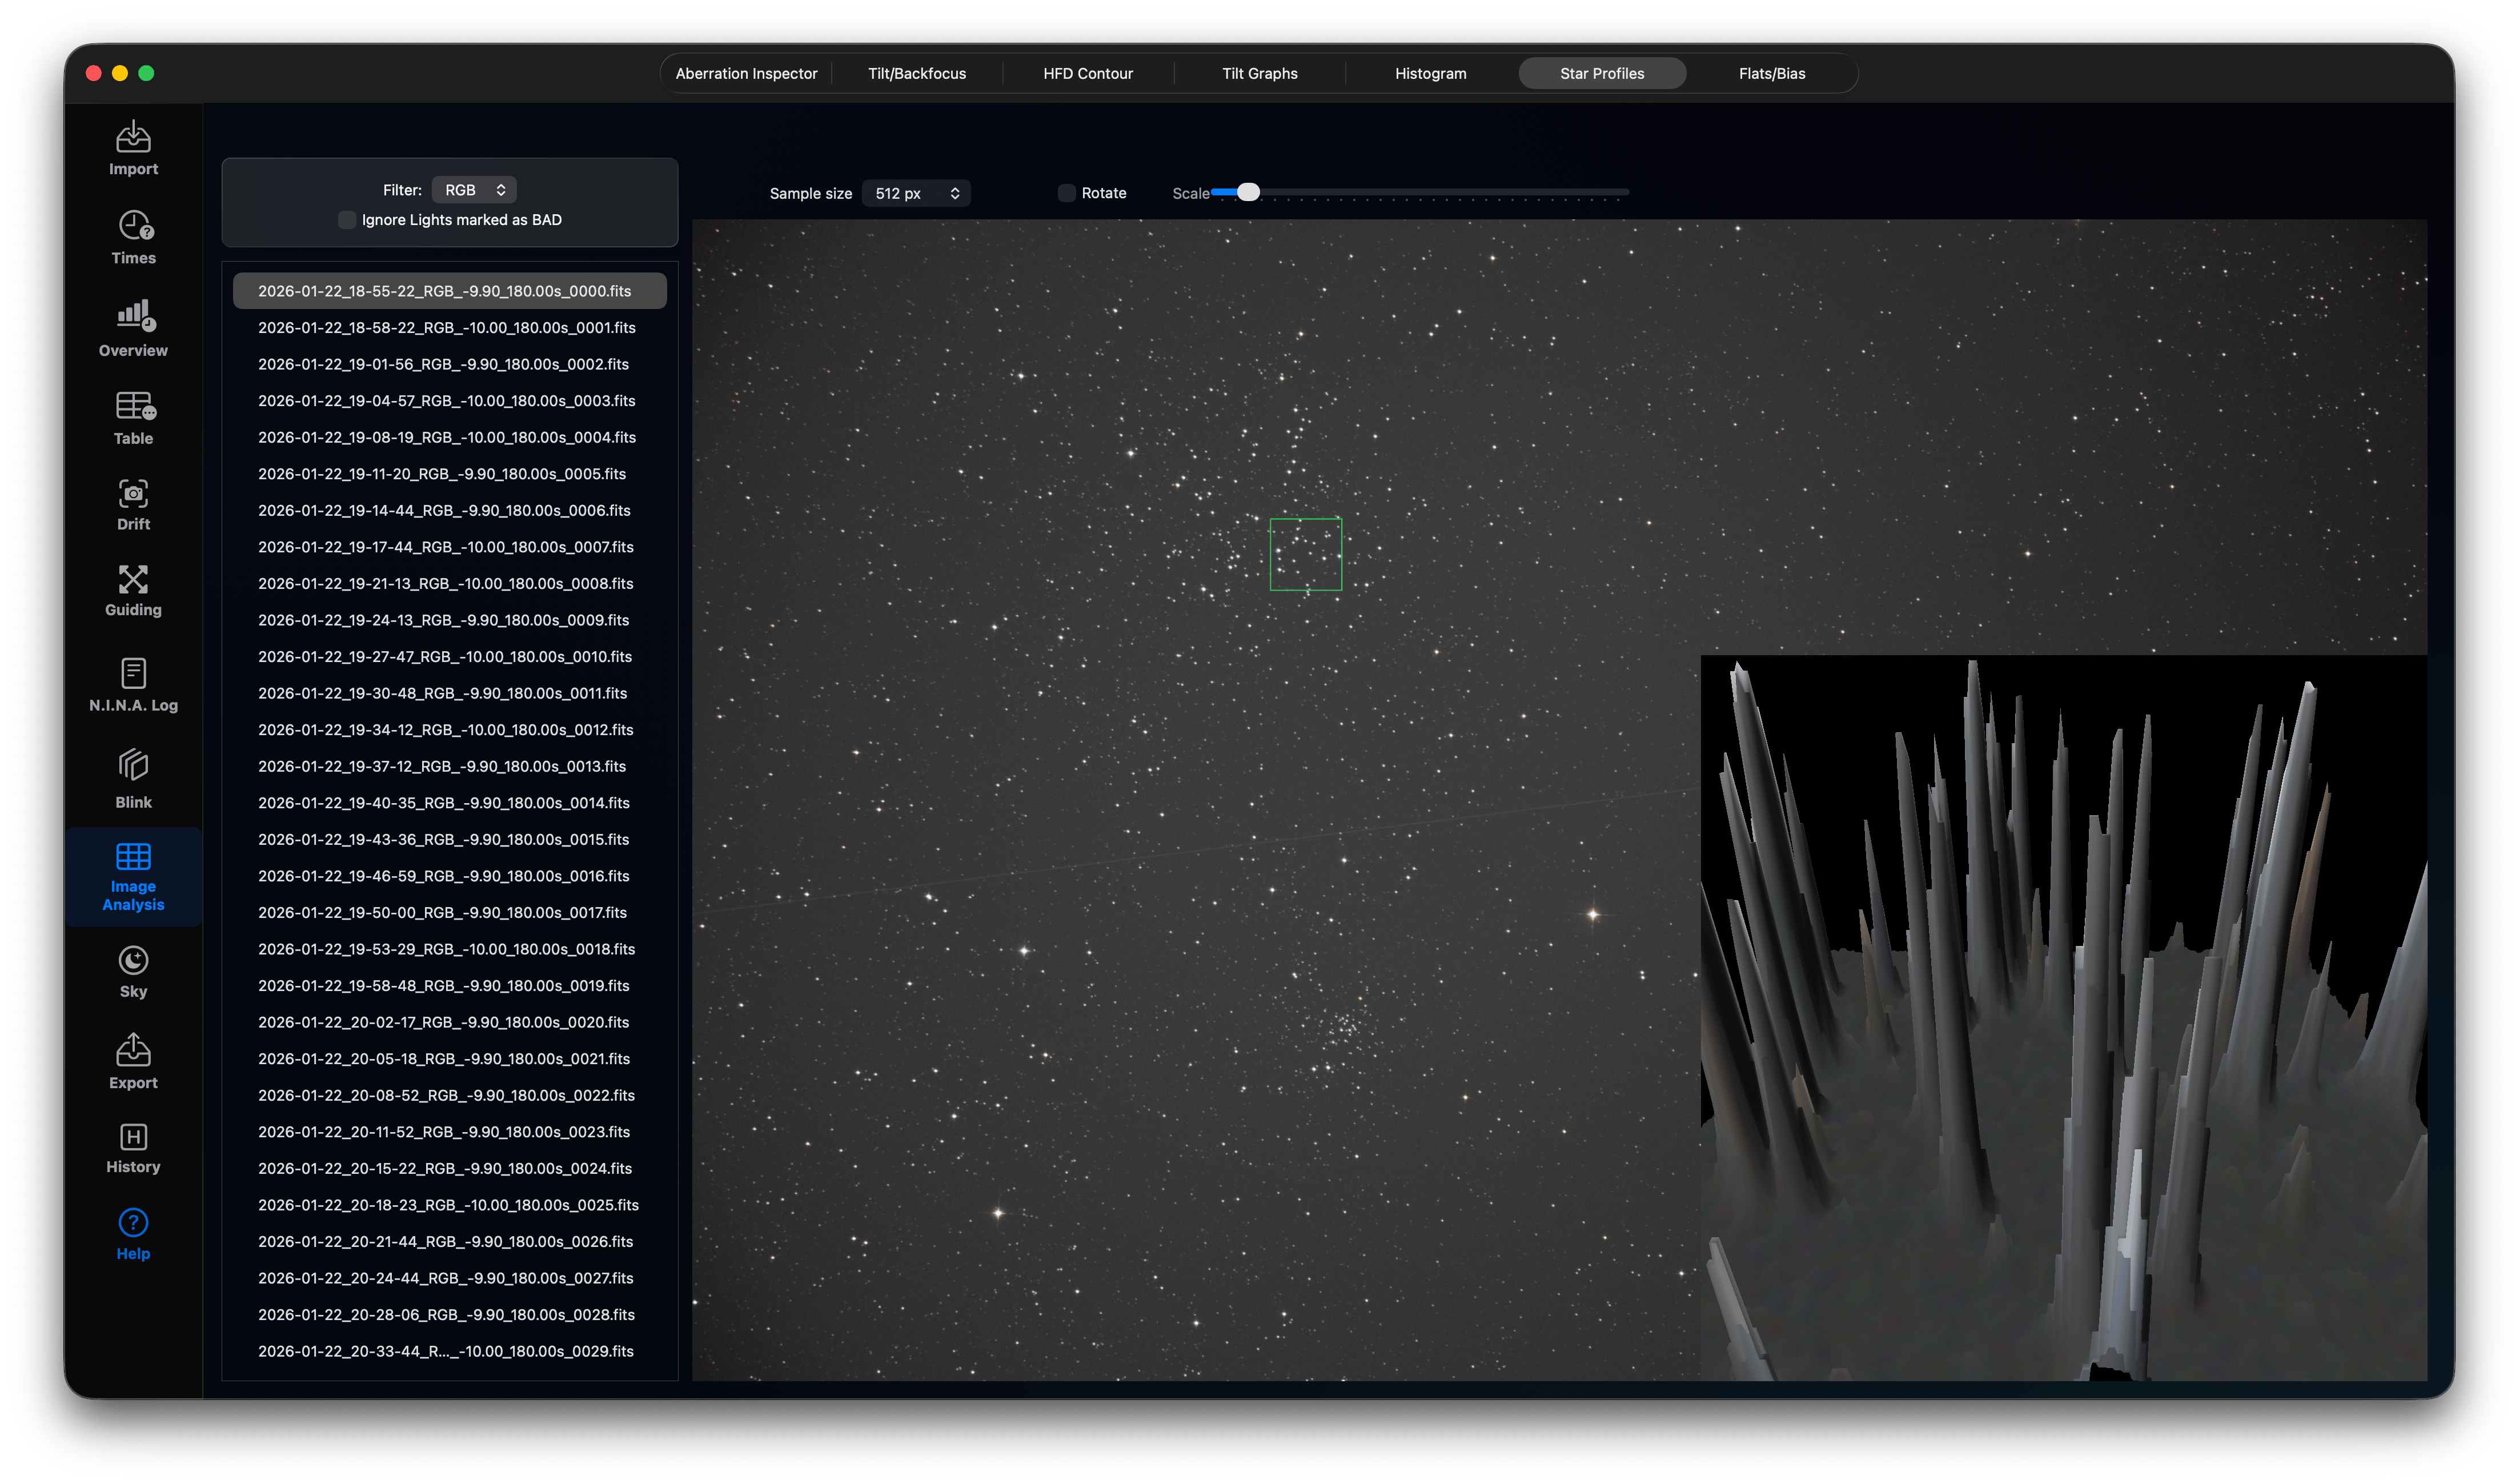
6. Star Profiles (3D)
Plots 3D star profiles (Point Spread Function) to help check star shapes and sky background noise levels. This has no special purpose, but it is fun to see the intensity distribution detailed in 3D. The sample size in pixels defines the size of the sampled region in pixels. You can scale down the 3D image and you can rotate it.
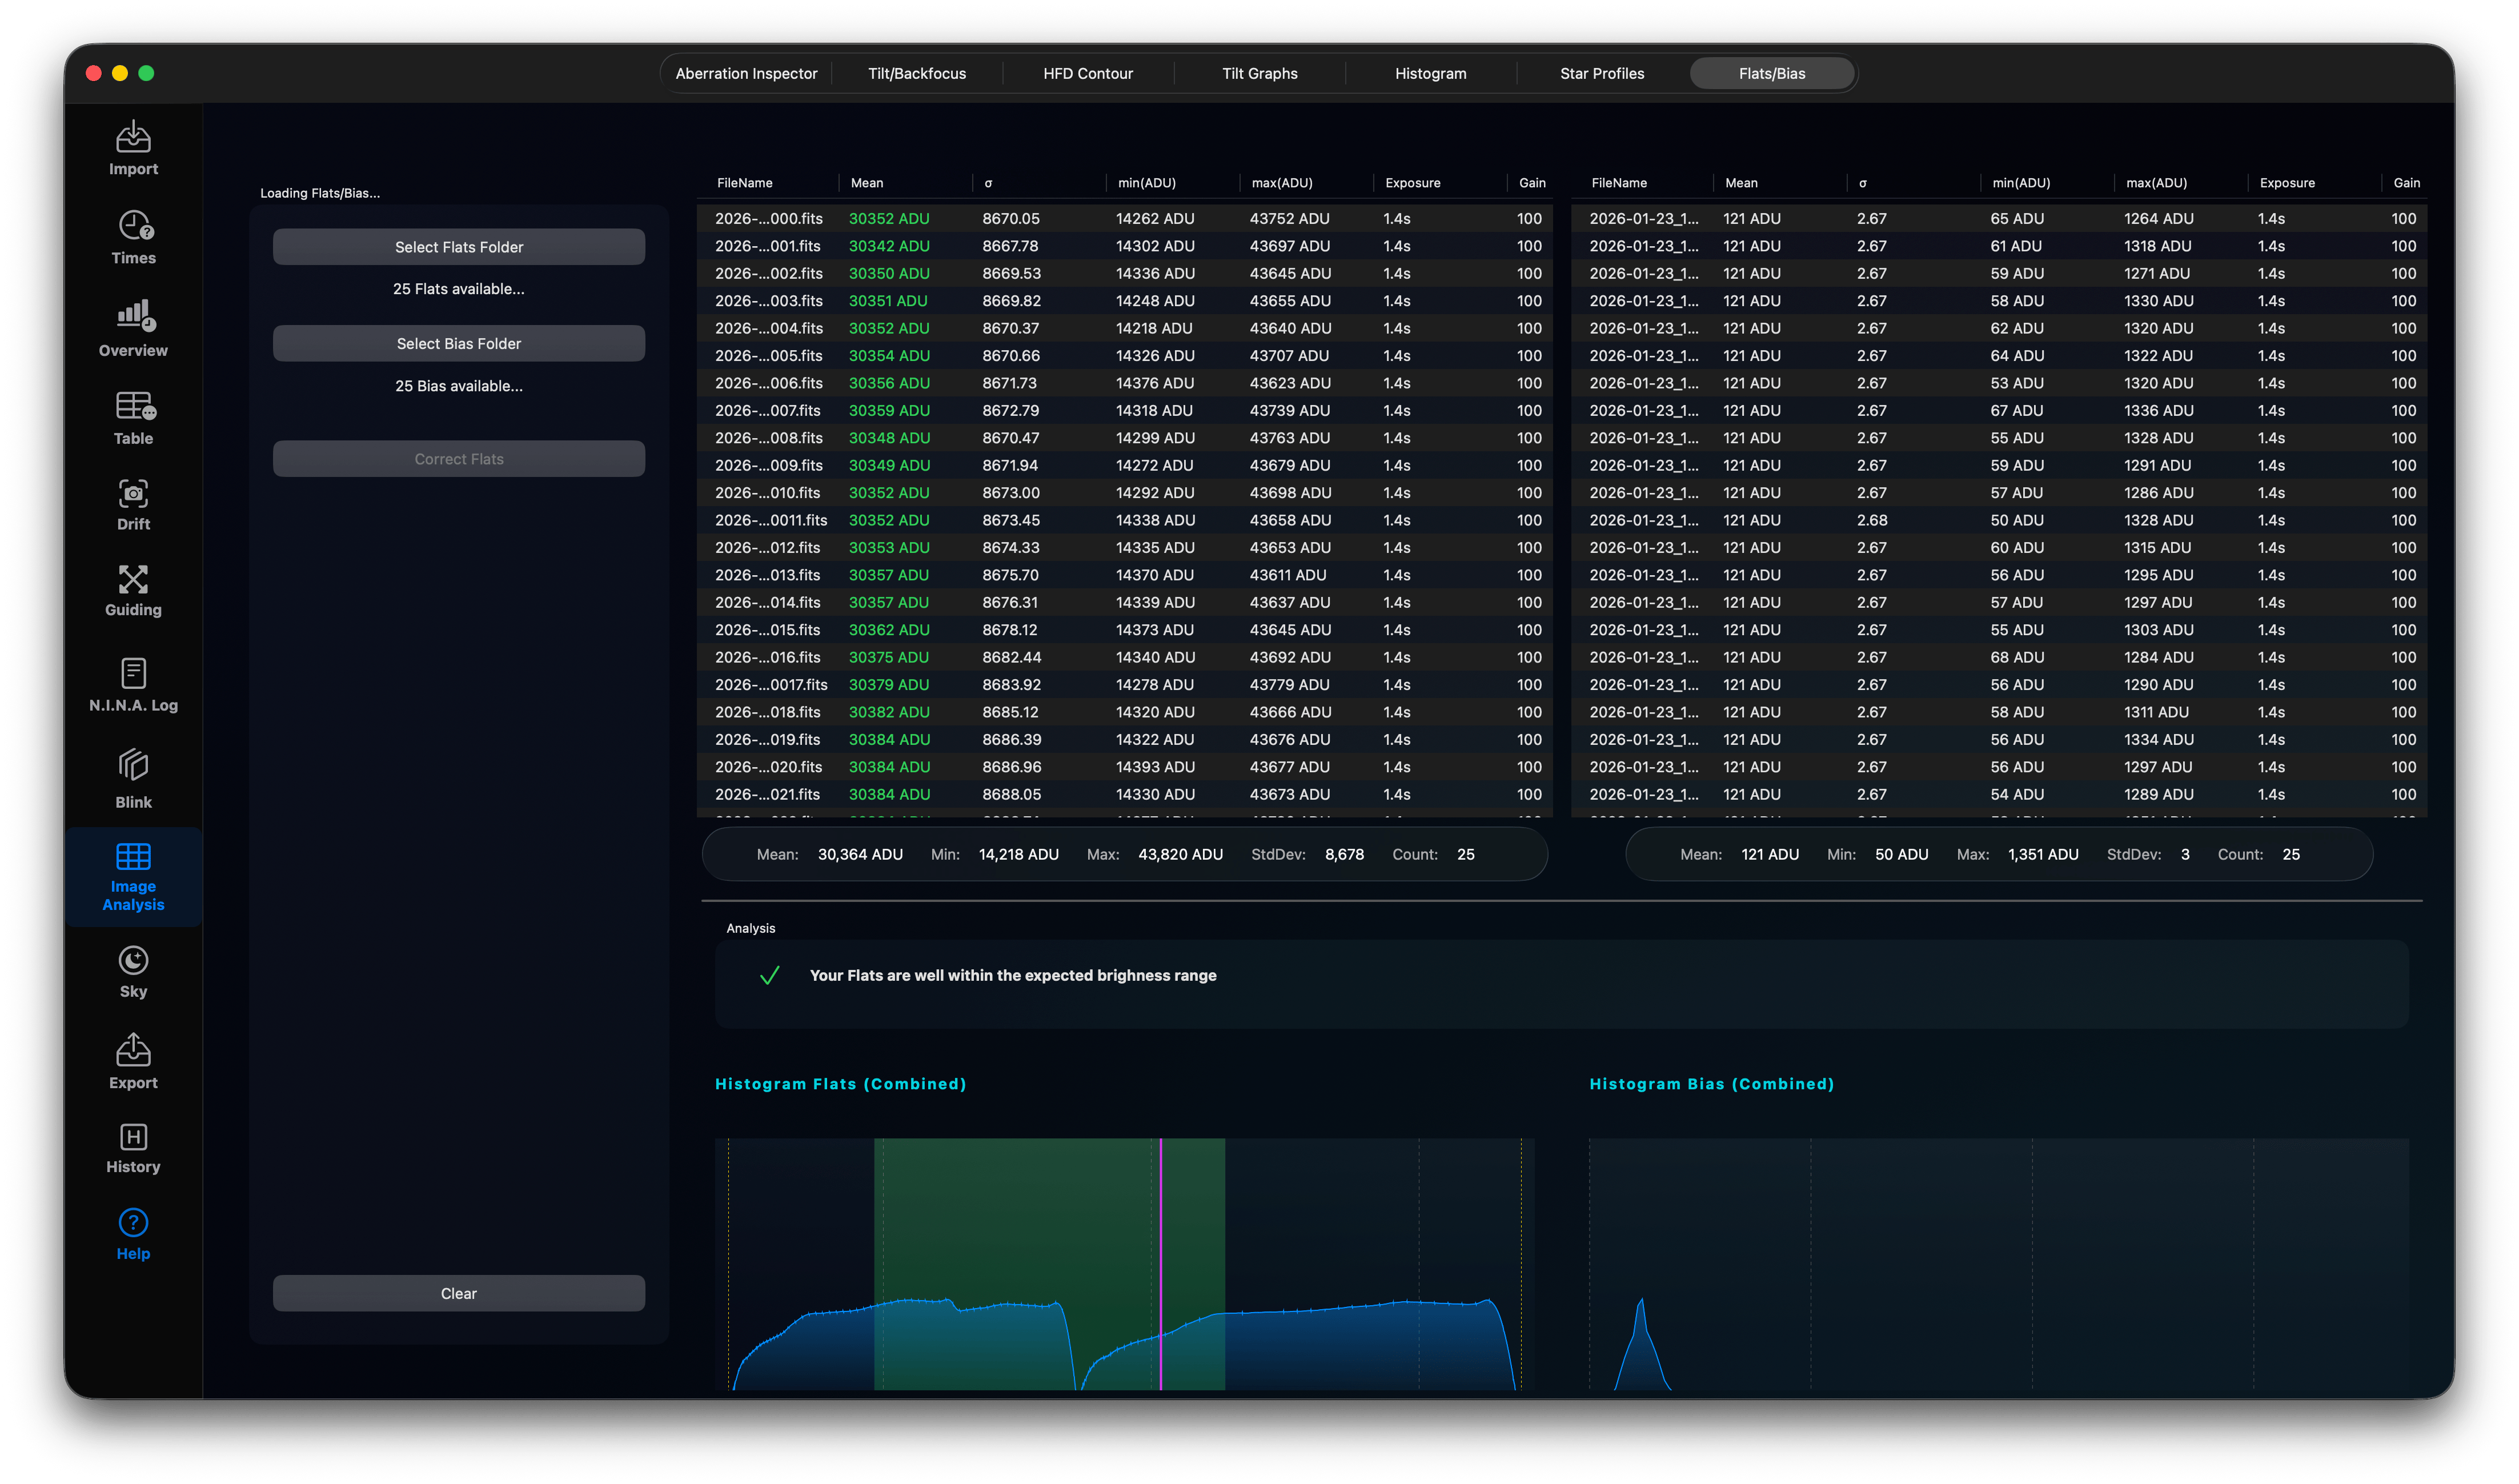
7. Flats/Bias Analysis
You can check your flats for temperature and exposure time. Select the Flats and Bias Folders to analyse your flats. The flats just be on average inside the green area. If the magenta vertical line is located on the left-hand side of the green area, your flats are too dark, on the right-hand side your flats are too bright. In both cases you can now correct the flats to bring them into the range. Of course, the best option would be to recreate the flats using correct settings, but sometimes this is not possible.